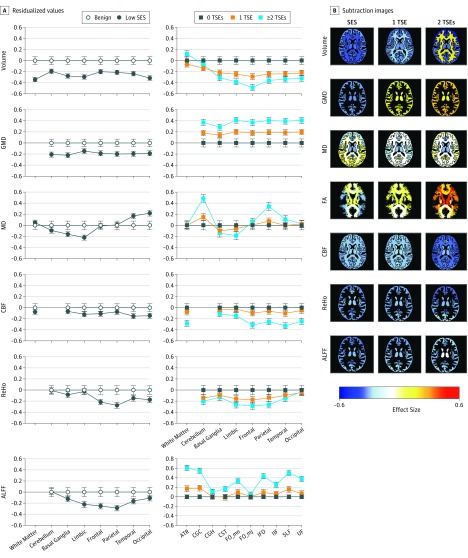
Figure 2. Association of Socioeconomic Status (SES) and Traumatic Stress Events (TSEs) With Multimodal Regional Brain Parameters.
A, Mean (SEM) residualized values compare groups with and without adversity and controlling for age, sex, and race for each region by modality for SES and TSEs. Whiskers indicate 95% CIs in the benign (control) group and SEM in the adverse (low SES and all TSA) groups. B, Subtraction images based on magnetic resonance imaging show the effect sizes of differences between groups with low SES compared with benign SES, with 1 compared with 0 TSEs, and with at least 2 compared with 0 TSEs. Images show z = 86, but each frame can be activated in a movie mode to scroll up and down the z scale in axial, sagittal, and coronal orientations (https://pennbbl.github.io/ers/index.html). ALFF indicates amplitude of low-frequency fluctuations; ATR, anterior thalamic radiation; CBF, cerebral blood flow; CGC, cingulate gyrus–cingulum bundle; CGH, cingulate gyrus proximal to hippocampus; CST, corticospinal tract; FA, fractional anisotropy; FO_mn, forceps minor; FO_mj, forceps major; GMD, gray matter density; IFO, inferior fronto-occipital fasciculus; ILF, inferior longitudinal fasciculus; MD, mean diffusivity; ReHo, resting state functional magnetic resonance imaging measures of regional homogeneity; SLF, superior longitudinal fasciculus; and UF, uncinate fasciculus. There is no graph for FA and SES because this effect size was not significant.

