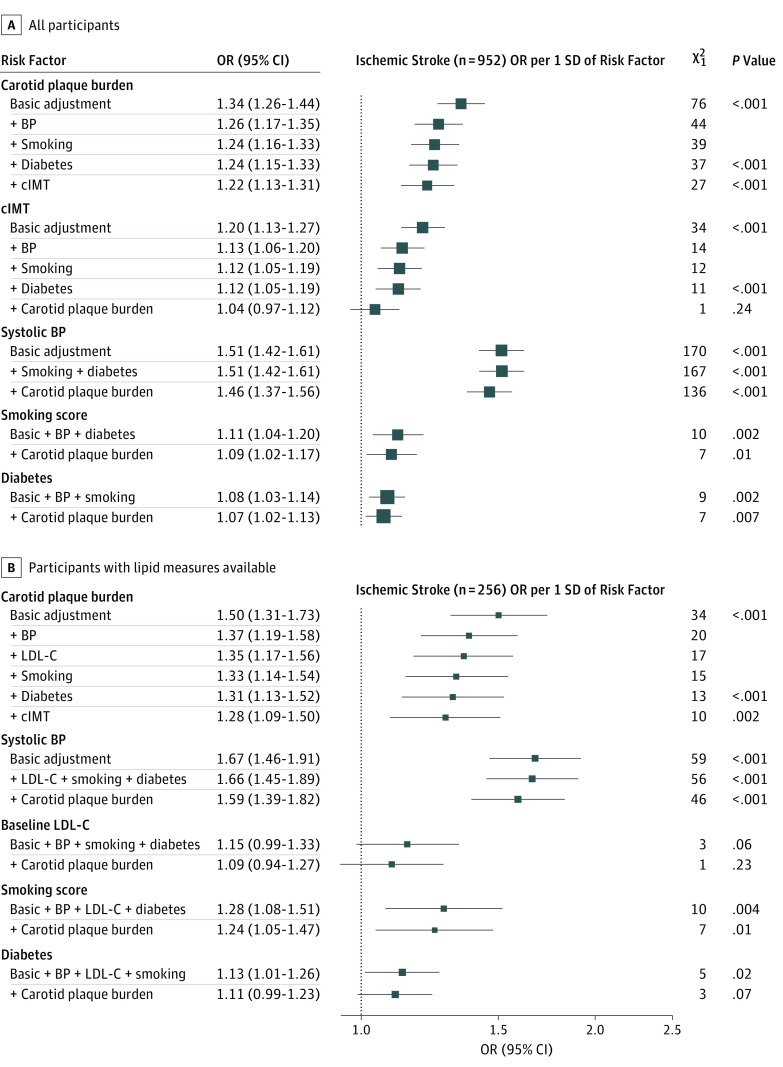
Figure 3. Associations of Carotid Measures and Major Cardiovascular Risk Factors With Ischemic Stroke.
Associations were determined for all participants (n = 23 973) (A) and those with lipid levels available (n = 2899) (B). The size of each square is proportional to the amount of statistical information. Basic adjustment was age, sex, and geographic area. P values are provided only for key comparisons to aid focus. Smoking adjustment is for terms in the smoking score. For consistency with other factors, diabetes odds ratios (ORs) displayed are per SD of diabetes prevalence; ORs associated with having diabetes are exp(log[displayed OR]/0.20). BP indicates blood pressure; cIMT, carotid intima-media thickness; and LDL-C, low-density lipoprotein cholesterol.

