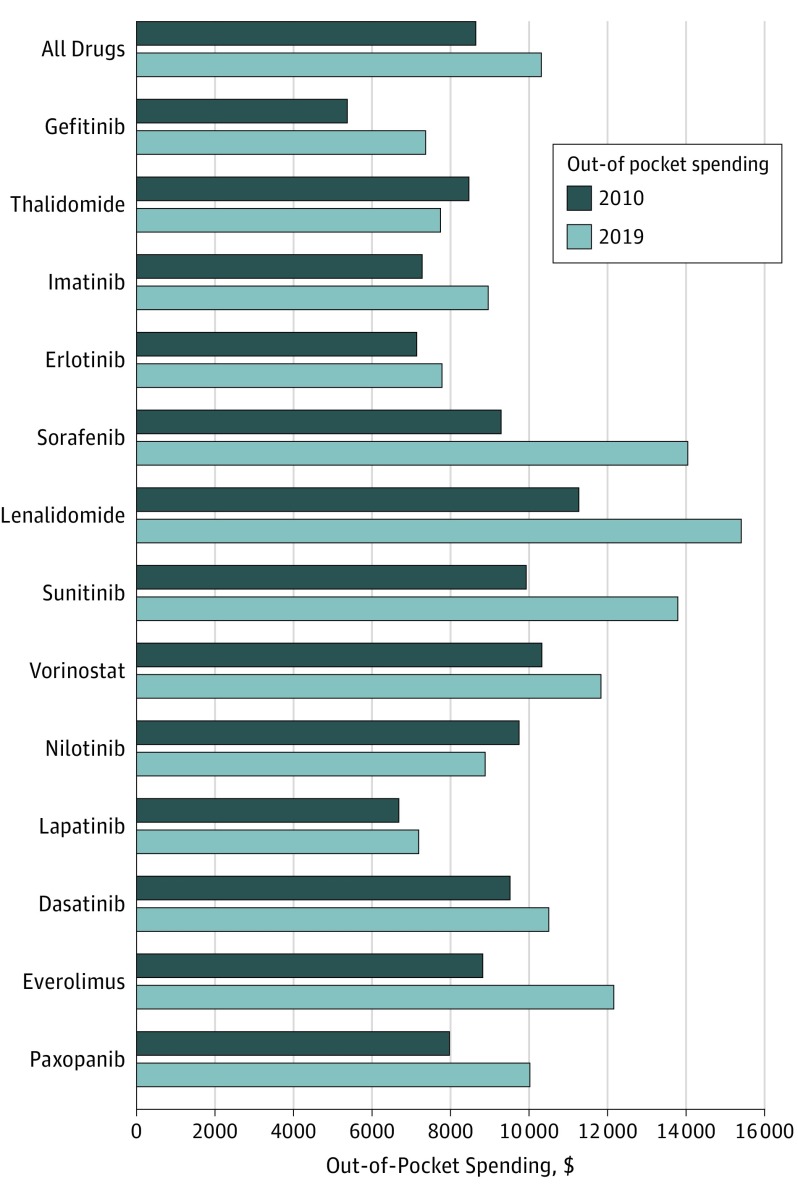
Figure. Expected Annual Patient Out-of-Pocket Spending for Anticancer Medications in 2010 and 2019 Benefit Designs.
The graph shows expected out-of-pocket spending for Medicare beneficiaries, assuming 12 months of therapy and the mean point-of-sale price for a 30-day or typical supply from the fourth quarter of 2010 and 2018, respectively. We also assumed that beneficiaries had no other medication use and used the standard benefit design (approximately 98% of plans required coinsurance for all drugs and years studied). Median prices resulted in similar spending and are not shown.

