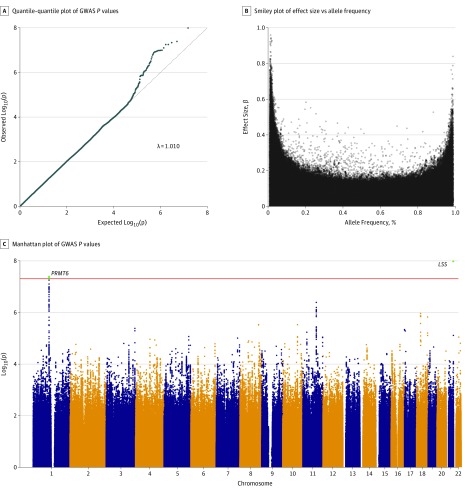
Figure. Results of Genome-Wide Association Study (GWAS).
A, Quantile-quantile plot of GWAS P values; little evidence for population stratification was found (λ = 1.01). B, Smiley plot of effect size vs allele frequency. C, Manhattan plot of GWAS P values. Two regions with genome-wide significant variations are highlighted.

