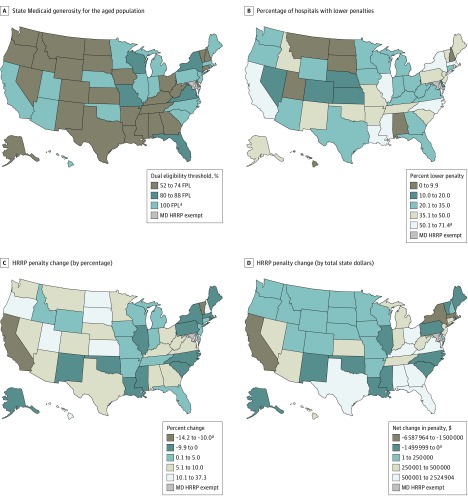
Figure 2. Geographical Distribution of Penalty Changes.
A, State Medicaid eligibility cutoffs for the aged population. B, Percentage of hospitals with lower penalties. C, Hospital Readmissions Reduction Program (HRRP) penalty change by percentage. D, HRRP penalty change by total state dollars. FPL indicates federal poverty level; MD, Maryland.
aAlso includes Washington, DC.

