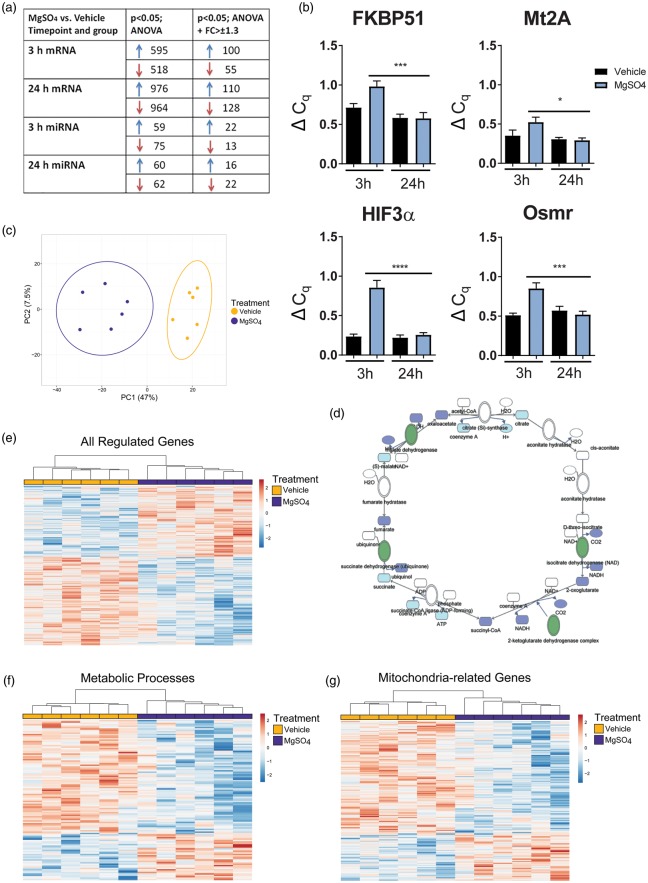
Figure 3.
MgSO4 PC causes regulatory changes in mRNA and miRNA and downregulation of metabolic and mitochondrial pathways. (a) Summary of mRNA and miRNA findings at 3 h and 24 h after administration of MgSO4 or vehicle, ANOVA p < 0.05 with and without fold change > ± 1.3. (b) RT-PCR results for a selection of genes upregulated at 3 h post injection with MgSO4 or vehicle; FKBP51 (from 0.52 ± 0.04 ΔCq; n = 6 to 0.85 ± 0.07 ΔCq; n = 6) (p = 0.0004); Mt2A (from 0.29 ± 0.03 ΔCq; n = 6 to 0.52 ± 0.06; n = 6) (p = 0.02); HIF3α (from 0.26 ± 0.03 ΔCq; n = 6 to 0.86 ± 0.09 ΔCq; n = 6) (p < 0.0001); Osmr (from 0.52 ± 0.04 ΔCq; n = 6 to 0.85 ± 0.07 ΔCq; n = 6) (p = 0.0003) (ANOVA, p < 0.05). (c) Principal component analysis plot of all regulated genes 24 h after MgSO4/vehicle injection (n = 6/group). (d) Network analysis demonstrates that several genes for enzymes in the citric acid cycle were downregulated (marked in green) after MgSO4 injection, including succinate dehydrogenase, malate dehydrogenase, isocitrate dehydrogenase and 2-ketoglutarate complex at 24 h. (e) Heatmap cluster of all genes from (a). (f–g) Heatmaps visualizing the genes regulated in metabolic (f) and mitochondrial (g) pathways at 24 h post MgSO4 vs. vehicle, respectively.

