
Fig. 2.
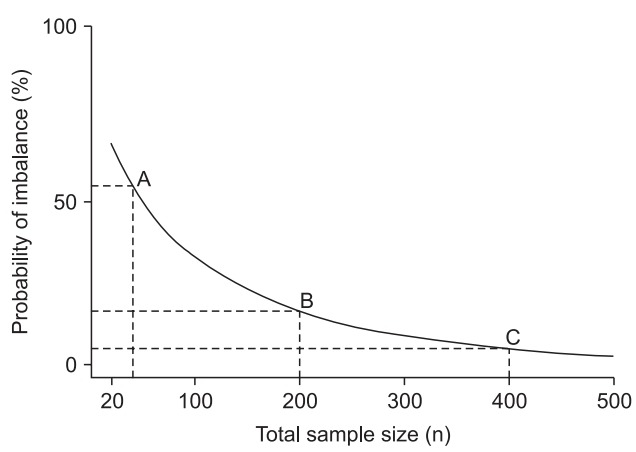
Probability curves of imbalance between two groups for complete randomization as a function of total sample size (n). When n = 40, there is a 52.7% chance of imbalance beyond 10% (allocation ratio 45%–55%) (point A). When n = 200, there is a 15.7% chance of imbalance (point B), but n = 400 results in only 4.6% chance of imbalance (point C).