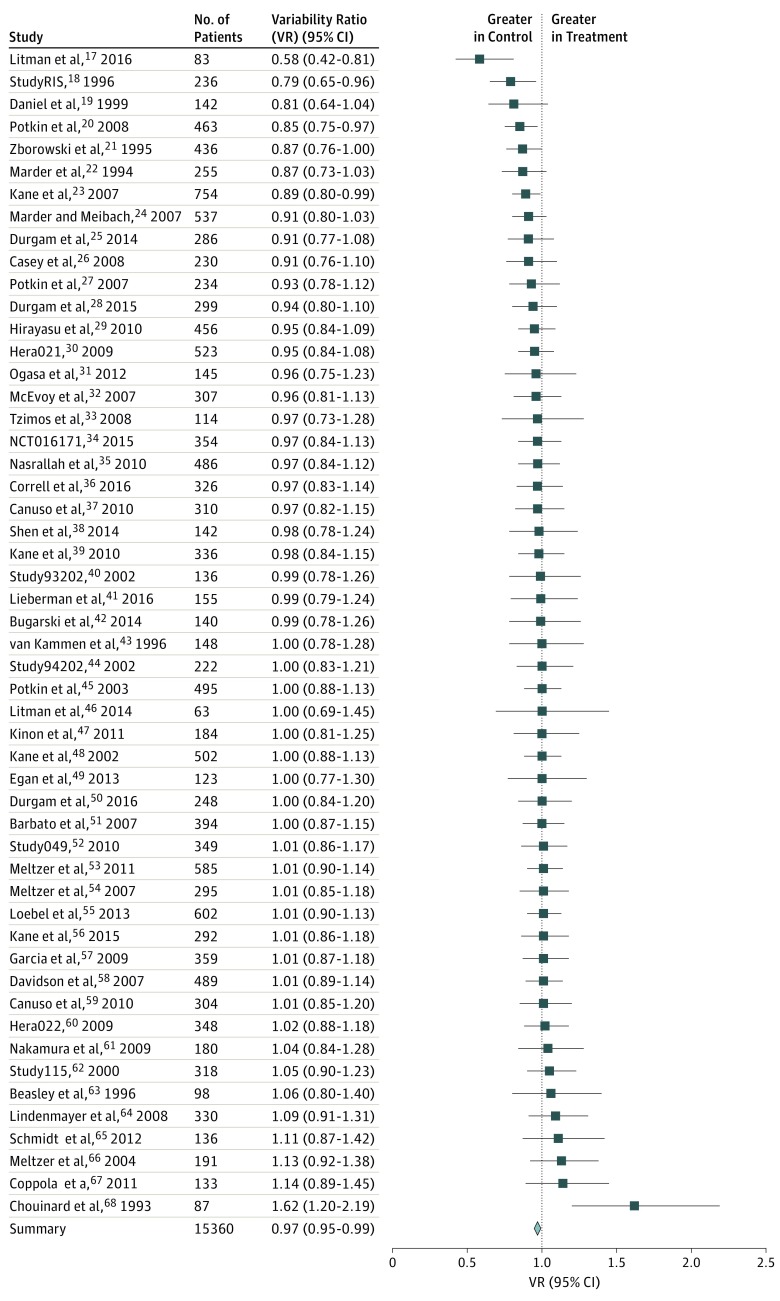
Figure 5. Lower Variability in the Treatment Group Compared With the Control Group Across Antipsychotic Drug Parallel Trials.
The forest plot shows the VR together with its 95% CI for treatment vs control across 52 studies. Each study is listed with its respective citation number. The overall VR was lower for treatment compared with control group.

