Fig. 4.

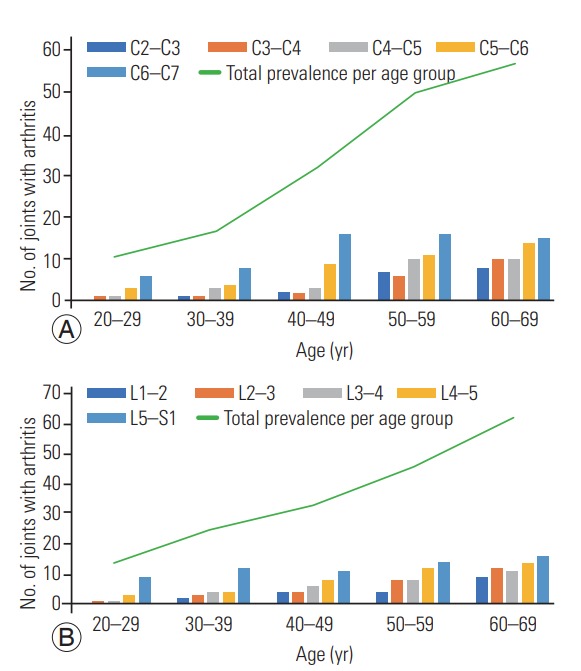
Each bar represents the number of facet joints at each spinal level, per age group, with signs of degeneration (grades 1, 2, 3). (A) Cervical facets with arthritis and (B) lumbar facets with arthritis.

Each bar represents the number of facet joints at each spinal level, per age group, with signs of degeneration (grades 1, 2, 3). (A) Cervical facets with arthritis and (B) lumbar facets with arthritis.