Figure 2.
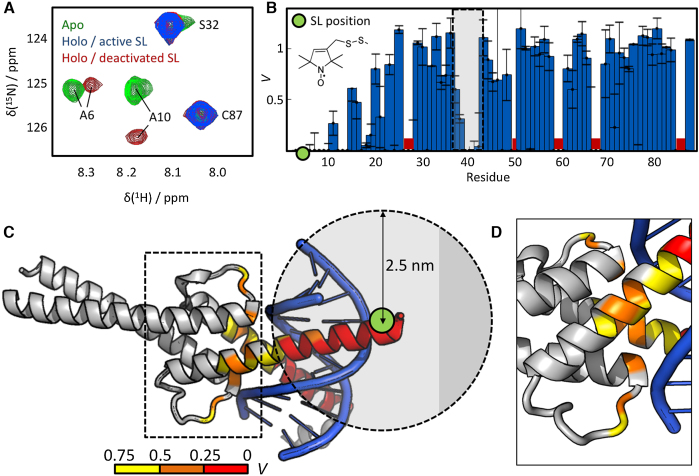
PRE NMR reveals conformational fluctuations of the MAX2/DNA complex. (A) Section of a 1H–15N HSQC of MAX2 in the DNA-free apo-state (green), the DNA-bound holo-state with an active SL attached to position R5C (blue) and in the holo-state with a deactivated, chemically reduced SL (red). No trace of residual apo-MAX2 is observed in the presence of DNA. Signals of residues located close to the labeling site are suppressed by the SL, while remote residues remain unaffected. (B) Residue dependence of the signal suppression ratio V between spectra with active and deactivated SL. Around the labeling site (green dot) signals are suppressed (V = 0 for residues 0–10) or reduced (V < 1 for residues 10–25). Signals between residues 38–42 (indicated by the gray shade) are likewise suppressed or reduced. The molecular structure of the MTSL label is indicated. Red bars indicate residues that were excluded from the analysis due to weak signals or overlap. (C) The intensity ratios V are mapped onto the crystal structure of MAX2/DNA (PDB entry 1HLO; for a DNA-free NMR-derived solution structure see PDB entry 1R05). The color code is indicated at the bottom. Residues 38–42, located in the HLH motif (indicated by the dashed box), are >2.5 nm distant from the labeling site (green dot). Contrary to the experimental observation, no strong signal reductions would therefore be anticipated for these residues based on the crystal structure analysis. (D) Zoom on the dashed box in (C). The reduced intensity ratio V in the HLH region indicates conformational fluctuations that lead to reduced distances between the SL and the HLH motif.

