Figure 3.
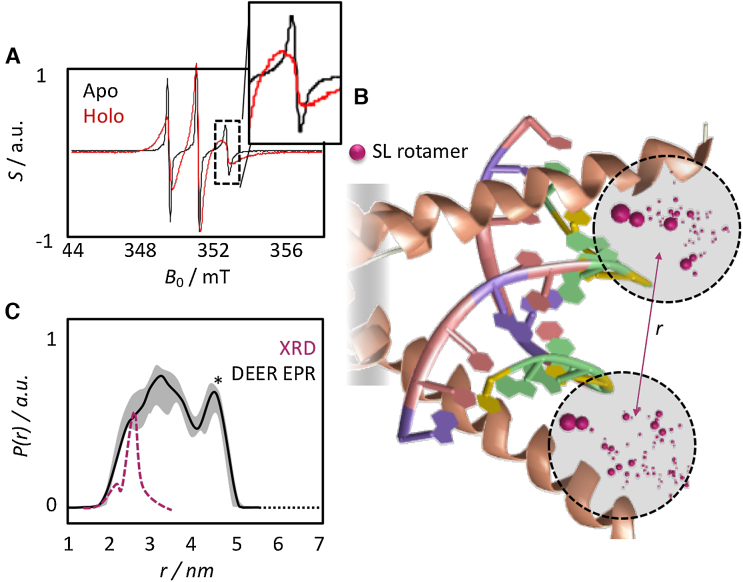
EPR reveals a conformational space with closed and opened DNA binding epitopes. (A) CW EPR of DNA-free apo-state (black; narrow signals), the DNA-bound holo-state (red; broad signals) of the SL-R5C mutant. Apo-MAX2 leads to sharp signals, which cannot can be observed in the presence of DNA. The insert shows a zoom on the high-field transition, where the difference between holo- and apo-state is most pronounced. (B) Graphical representation of the rotamer distribution of the two SL in the DNA-bound R5C mutant based on the crystal structure of MAX2/DNA (PDB code: 1HLO). Purple spheres indicate the position of the unpaired electron in the MTSL labels predicted by the MMM software (see main text). Relative sizes correspond to relative populations of the respective rotamers. (C) Experimental (black) and MMM-predicted (purple) distance distribution P(r) between the two spin labels in SL-R5C MAX2. The crystal structure (XRD) analysis yields a sharp distribution centered ∼2.5 nm. The experiment in vitrified solution yields a broad distribution indicating a continuum of co-existing conformations with distances between the two labeling sites varying between 2 and 5 nm. This indicates that the NTD samples states between two limiting cases, an open and a closed conformation around the bound DNA strand. The error is indicated as grey shade. The peak marked with the asterisk might be subject to uncertainties (see the supplementary material).

