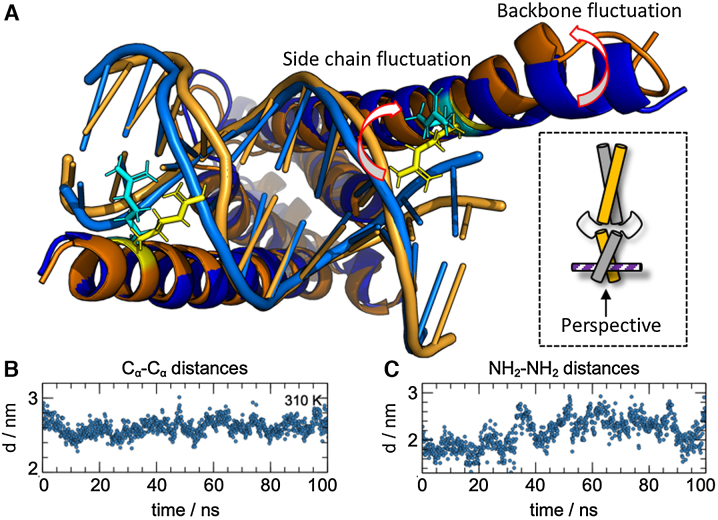
Figure 4.
MD simulations visualize opened and closed conformations of the NTD of holo-MAX2. (A) Representative structures for opened (orange) and closed (blue) conformations sampled in our MD simulations. The arrows indicate how the side chains of residues R5 wrap around the DNA in the closed conformation, but release it in the open conformation, and how the helical backbone loosens from the bound DNA ligand. (B) Cα–Cα distances, representative of the separation between the backbones of the two helices, for residues R5 (the MTSL labeling sites) during the MD run for each time frame in a 100 ns simulation at 310 K. (C) NH2–NH2 distance, representative for the separation between side chains, for residues R5 (the MTSL labeling sites) during the MD run for each time frame in a 100 ns simulation at 310 K.

