
Figure 3.
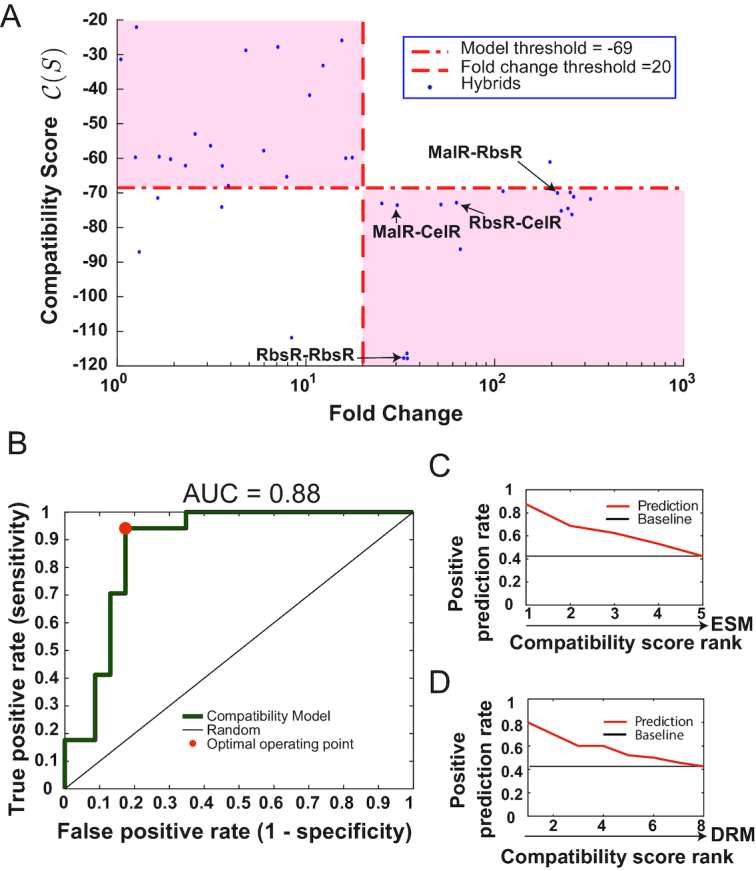
Global inference performance metrics of the hybrid compatibility score C(S) on predicting functional hybrid repressors. (A) Collection of hybrids with their corresponding experimental fold change measurements (x-axis) and C(S) scores (y-axis). The dashed line depicts the threshold for the experimental fold change, classifying the hybrids into two classes: inducible hybrids with fold increase ≥20 and non-inducible hybrids with fold change <20. The dash-dotted line denotes the threshold for compatibility score, classifying the hybrids into two classes: predicted to be compatible for hybrids with score ≤–69 and non-compatible hybrids with C(S) > –69. The shaded areas delimited by C(S) and fold response thresholds are regions where the model was able to correctly classify the response of the hybrid. The repressors used for building double toggle system described are indicated with arrows. (B) The ROC curve of the compatibility score model with fold change threshold at 20. The area under the curve is 0.88. The optimal operating point is highlighted by a dot in the curve. The black line indicates the performance of a random predictor. (C) Positive prediction rate of a C(S)-ranked set of hybrid repressors sharing a common DRM. There are 8 sets that contain five hybrids with different ESMs for each set. The positive prediction rate (y-axis) was calculated as the proportion, out of these eight repressors, with fold change ≥20 for each compatibility score rank category (x-axis). The best-ranked hybrid has a high probability to be functional. (D) Positive prediction rate of a C(S)-ranked set of hybrid repressors sharing a common ESM. In this case, there are five groups of hybrids with the same ESM and for each set there are eight different DRMs. The positive prediction rate is computed as in (C) for these hybrids. The best ranked scores indicate with high probability that the hybrid will be functional.