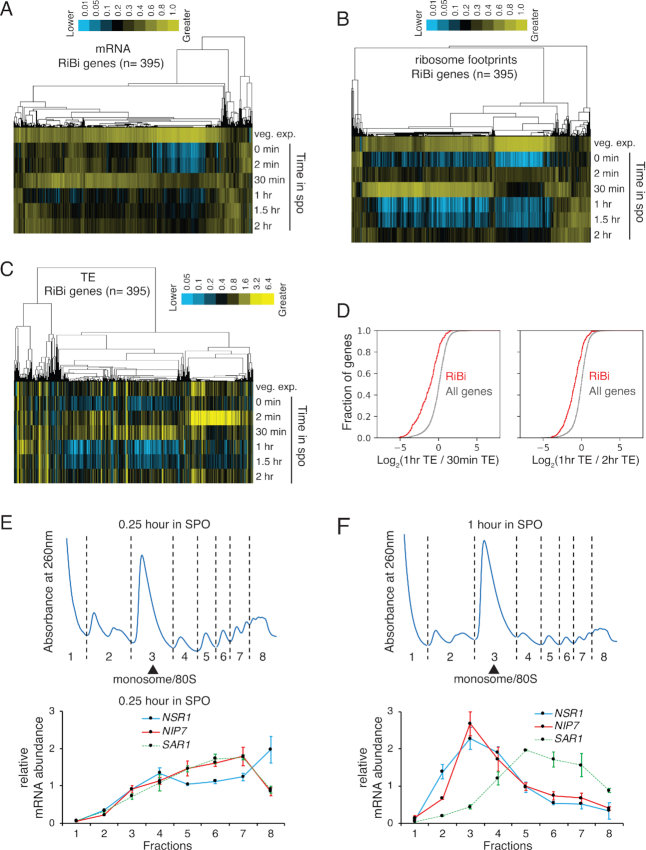
Figure 1.
RiBi genes show translational repression at 1 h in sporulation medium. (A–C) mRNA-seq, ribosome profiling, and TE values of RiBi genes from a high-resolution timecourse of the budding yeast meiotic program (17). Data are clustered by similar expression patterns of genes (columns) across timepoints in sporulation medium (rows). (D) Left: a cumulative histogram showing log2 values of the ratio between 1 h and 30 min TEs. The red line represents RiBi genes and the gray line represents all genes. A Kolmogerov–Smirnov (K–S) test was used to determine significance. P = 7.99E–54. Right: a cumulative histogram showing log2 values of the ratio between 1 and 2 h TEs. The red line represents RiBi genes and the gray line represents all genes. K–S test P = 1.75E–48. (E and F) Distributions of RiBi mRNA (NSR1 and NIP7) and non-RiBi mRNA (SAR1) in polysome gradients as determined by RT-qPCR. Error bars represent measurement variability as determined by three qPCR replicates. The sample shown in panel E was collected at 0.25 h in SPO, and the sample shown in panel F was collected at 1 h in SPO. Polysome gradients for these timepoints are shown above in each case.

