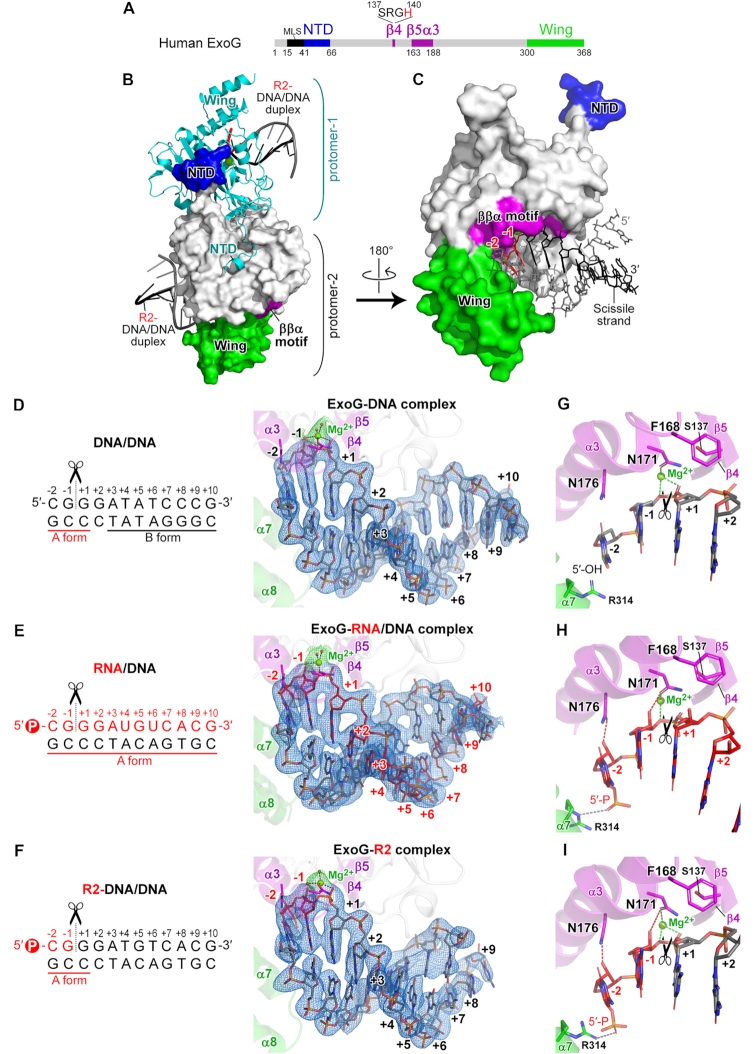
Figure 3.
Crystal structures of human ExoG in complex with DNA, RNA/DNA hybrid and RNA–DNA chimeric duplexes reveal its preference for binding an A-form duplex. (A) Domain organization of human ExoG, comprising MLS (mitochondrial localization sequence), NTD (N-terminal domain), nuclease core (in grey), and C-terminal Wing domains. The active site of ExoG is located in the ββα-metal motif (in purple), with a signature SRGH sequence. (B) The crystal structure of the ExoG–R2 complex. Each protomer of the ExoG dimer is bound with one R2-DNA/DNA duplex. Protomer-1 is shown as a cyan ribbon model, whereas protomer-2 is displayed as a surface model and colored according to panel A. (C) Enlarged view of protomer-2 in panel B. The –2 and –1 ribonucleotides that are embedded in the substrate-binding groove are colored and labeled in red, and the other deoxyribonucleotides in the chimeric scissile strand are in black. The non-scissile DNA strand is colored in grey. (D–F) Enhanced view of the bound substrate in the three solved structures generated in this study. Blue meshes represent composite omit electron density maps (2mFo – DFc, σ = 1.0) of the bound duplexes calculated by PHENIX (37). Ribonucleotides and deoxyribonucleotides are respectively colored in red and black. (G–I) Enhanced view of the active site in ExoG–DNA, ExoG–RNA/DNA and ExoG–R2 complex structures, respectively. Dotted lines show the coordination of catalytic Mg2+ with N171 and the scissile phosphate (green), N176- and N171-mediated RNA-specific interactions (red), and interaction between R314 and the 5′-phosphate (gray). In all panels, black scissors indicate ExoG’s cleavage site.

