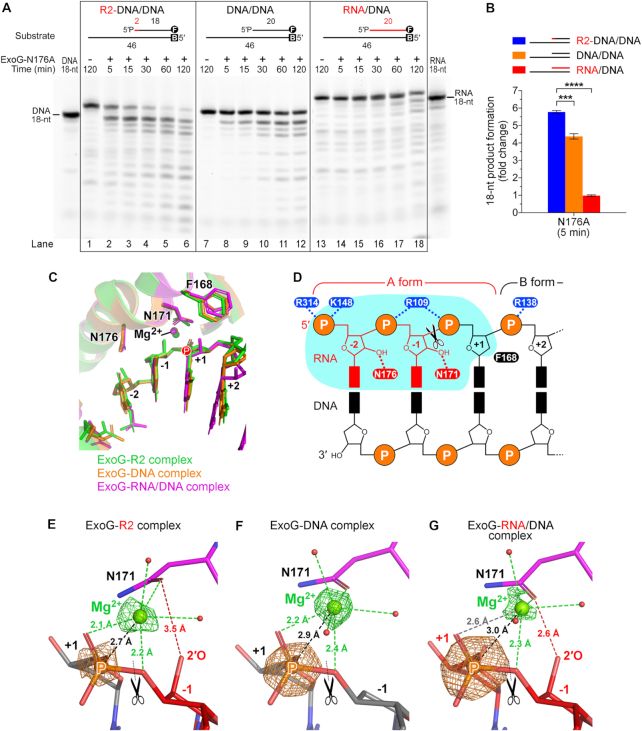
Figure 4.
ExoG preferentially recognizes two RNA nucleotides and one DNA nucleotide flanking its cleavage site by conserved Asn and Phe residues. (A) Time-course nuclease activity assays of the ExoG-N176A mutant (1.25 nM) degrading R2-DNA/DNA, DNA/DNA and RNA/DNA substrates (100 nM). Markers for 18-nt DNA and RNA are displayed on either side of the gels. DNA substrates are labeled with FAM (marked as circled F) at 3′ end for detection, and/or biotin at 5′ end (marked as B) for capping with NeutrAvidin in the reaction condition to block the activity of ExoG. (B) Quantification of the 18-nt product generated by the ExoG-N176A mutant at 5 min. Error bars represent the standard errors from at least four replicates of the experiment. Statistical significance (P values) was determined by an unpaired two-tailed Student's t-test, with **** representing P < 0.0001 and *** representing P < 0.001. (C) Superimposition of the active site in the three solved structures in this study. Capital letter P highlights the position of the scissile phosphate. (D) Schematic model showing that ExoG specifically recognizes the RNA–DNA junction in a chimeric RNA/DNA hybrid duplex. The deep substrate-binding groove accommodating the –2 and –1 nucleotides is shaded in cyan. (E–G) Enlarged view of the catalytic Mg2+ in the three solved structures generated in this study. Green and orange meshes show the omit electron density maps (mFo– DFc) of Mg2+ and the scissile phosphate (labeled with a capital letter P), respectively. The map contour (σ) is at 11.0 for the ExoG–DNA complex and at 8.0 for the ExoG–R2 and ExoG–RNA/DNA complexes. Dotted lines represent the distance between Mg2+ and the scissile phosphate (black), Mg2+ coordination (green), and interaction between Oδ of N171 and the 2′-OH group of the –1 ribonucleotide (red). In all panels, black scissors indicate the ExoG cleavage site.

