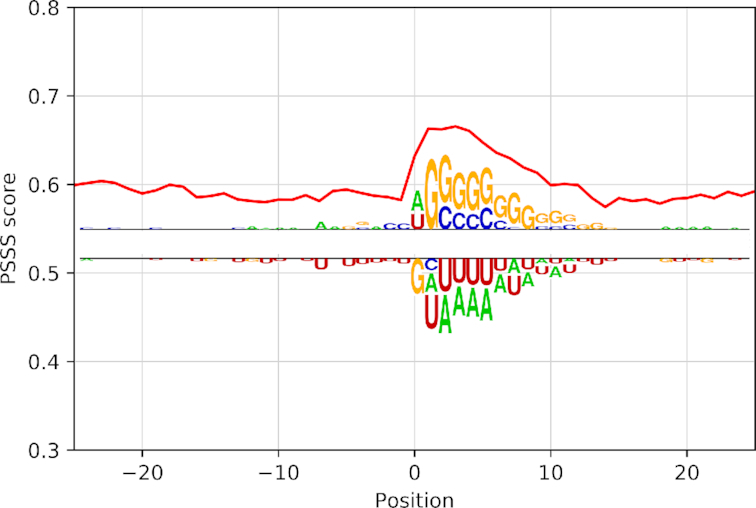
Figure 4.

Structural trend and sequence motifs for miRNA targets. Red lines correspond to PSSS mean score; the weblogo shows the sequence motif identified (top) in that specific regions compared to background (bottom). Here, position 0 corresponds to miRNA binding site as described in methods.
