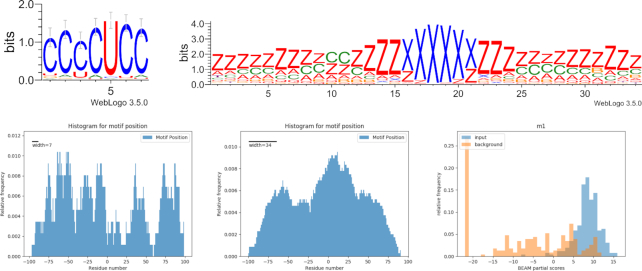
Figure 6.
TINCR interaction landscape. Top: sequence and structure motifs shared by 16% of the sequences. Bottom: location of sequence (left) and structure (center) motifs; the residue in position #0 corresponds to the start of the binding site reported by the experiment. Lower right: score distributions of input sequences and background sequences with respect to the motif model.

