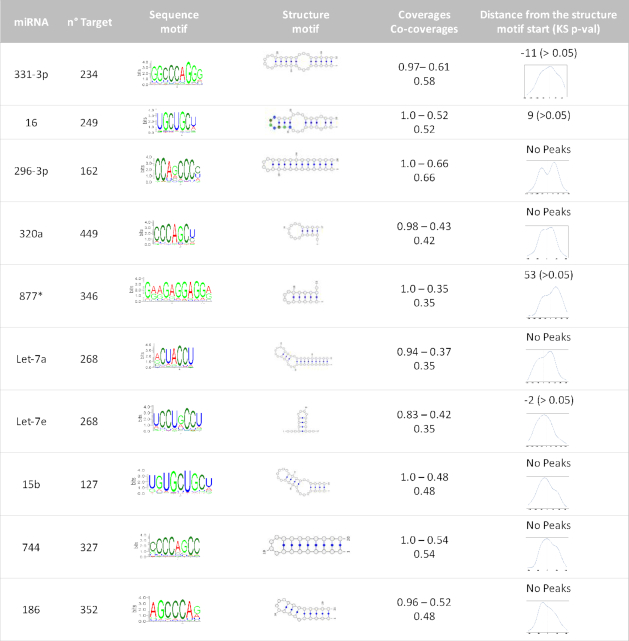
Table 2.
Ten representative sequence-structure motif pairs. From the first column: miRNAs, the number of interactors for each miRNA, the web logo of the sequence motif found, the structure motif best representative, sequence motif coverage, structure motif coverage and co-coverage of the pair. Last column contains an estimate of the enriched distance (if present) between sequence and structure motif. If the two motifs overlap, the model structure in the fourth column as a color-coded sequence motif, otherwise a KDE is shown in the last column (in nucleotide units)

|
