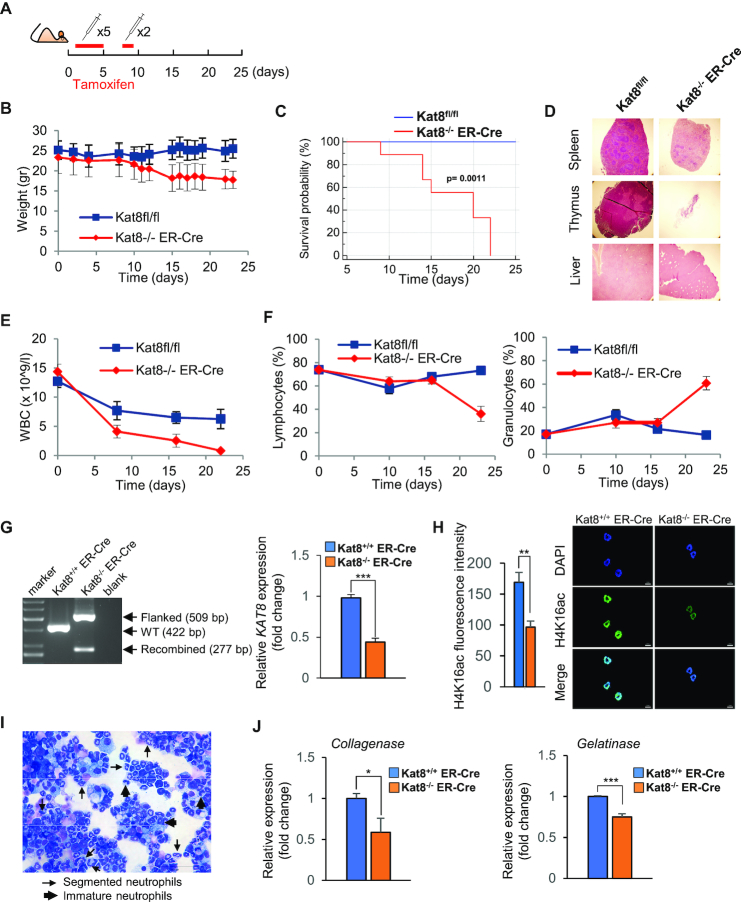
Figure 3.
Role of H4K16ac in peripheral white blood cells. (A) Diagram showing the timeline for tamoxifen administration in Kat8fl/fl mice with and without the inducible ubiquitous Cre (Kat8fl/fl (n: 5) and Kat8fl/fl;ER-Cre (n: 8)). (B) Weight evolution of control and Kat8−/−;ER-Cre mice after tamoxifen treatment. (C) Kaplan–Meier survival curve showing that Kat8−/−; ER-Cre mice (red line) differs significantly from Kat8fl/fl mice (blue line) (P-value = 0.0011, Kaplan–Meier log-rank test). (D) Representative images of spleen, thymus, and liver from Kat8fl/fl and Kat8−/−;ER-Cre mice showing differences in the size of the organs. Line plots showing (E) differences in total number of white blood cells and (F) percentage of lymphoid and myeloid cells between Kat8fl/fl; ER-Cre and Kat8−/− mice after tamoxifen treatment. (G). Genotype analysis of Kat8 locus using PCR specific primers on genomic DNA from Kat8+/+;ER-Cre (pool, n: 3) as well as Kat8−/−;ER-Cre (pool, n: 3) mice cells after tamoxifen treatment. The double band indicating approximately 30% excision of Kat8 was only detected in mice containing the floxed alleles after treatment with tamoxifen. On the right, RT-qPCR showing downregulation of Kat8 in the cKit+ progenitors. Expression levels determined by real time-qPCR are an average of triplicated measurements (+SD), normalized to transcript levels of beta Actin, and represented as a fold-change relative to the Kat8+/+;ER-Cre control (a t-test showed significant differences; ***P < 0.001). (H) Representative immunofluorescence images showing lower levels of H4K16ac in Kat8−/−;ER-Cre. Average H4K16ac fluorescence intensity was quantified using ZEN lite software (a t-test showed significant differences; **P < 0.01). (I) May Grünwald Giemsa stain (40×) after in vitro differentiation to neutrophils (day 7). (J) Expression of two markers (Collagenase and Gelatinase) of neutrophilic differentiation (Pham, C., Nature Reviews Immunology, 2006) (day 7). Expression levels determined by real time-qPCR are an average of triplicated measurements (+SD), normalized to transcript levels of beta Actin, and represented as a fold-change relative to the Kat8+/+;ER-Cre control (a t-test showed significant differences; **P < 0.01, ***P < 0.001).

