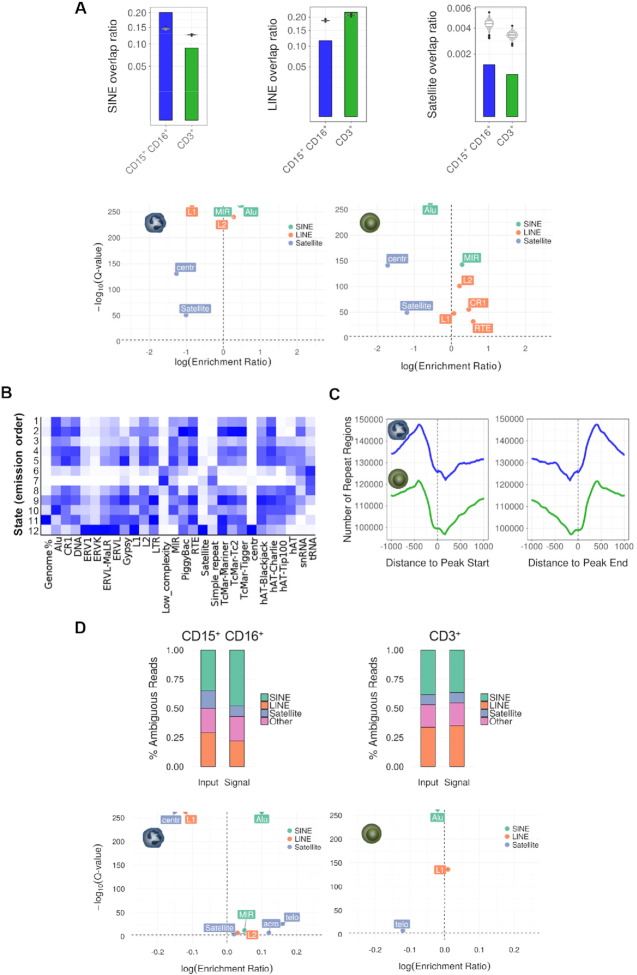
Figure 5.
Distribution of H4K16 acetylation at specific repetitive DNA elements in neutrophils and CD3+ T cells. (A) Bar plots showing the overlap between H4K16-enriched peaks and different types of DNA repeats, obtained in the analyses of unique mapped reads. Violin plots represent a permutation-based null distribution for each type of repeated DNA overlap ratio for each peak data set. Lower panels show associations between different types of repetitive DNA elements with H4K16ac peaks in neutrophils and CD3+ T cells, ranked by Q-value, and enrichment score (relative risk). (B) Enrichment of the 12 chromatin states described in Figure 2F in different types of DNA repeats. (C) Plot showing the coverage of repetitive elements in the regions flanking the H4K16ac enriched peaks obtained in the analyses of unique mapped reads in both cell types. (D) Stacked bar charts describing the classification of ambiguous reads for neutrophil and CD3+ T cell signals relative to the corresponding input, and according to the enrichment in different types of DNA repeats. Lower panels show associations between different types of repetitive DNA elements with probable H4K16ac-enriched regions obtained from ambiguous mapping in neutrophils and CD3+ T cells, and ranked by Q-value, and enrichment score (relative risk).

