
Figure 6.
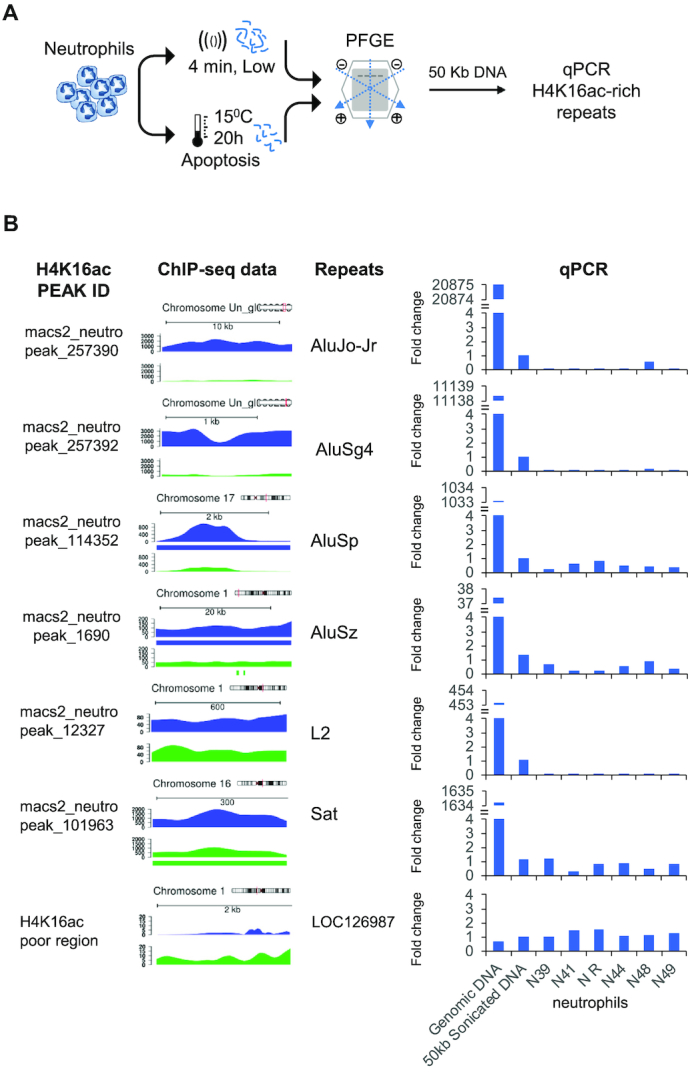
Associations between H4K16ac enriched regions and DNA breakage during neutrophil apoptosis. (A) Schematic representation of the pulsed-field gel electrophoresis (PFGE) experiment to analyze the 50 kb DNA fragments from apoptotic neutrophils. (B) qPCR amplification of specific H4K16ac-enriched repeats using the 50kb DNA fragments from the PFGE. Data are an average of triplicated measurements, normalized to a H4K16ac-poor region of the albumin gene, and represented as a fold-change relative to the 50kb sonicated DNA. Intact DNA and 50kb random fragments from a pool of samples were used as positive controls. H4K16ac peaks identified by MACS2, and genome diagrams showing the relative enrichment of H4K16ac in neutrophils (blue), and CD3+ T cells (green) are shown on the left. Significant H4K16ac peaks showing fold change above 1.5 are indicated by a colored bar below the profile.