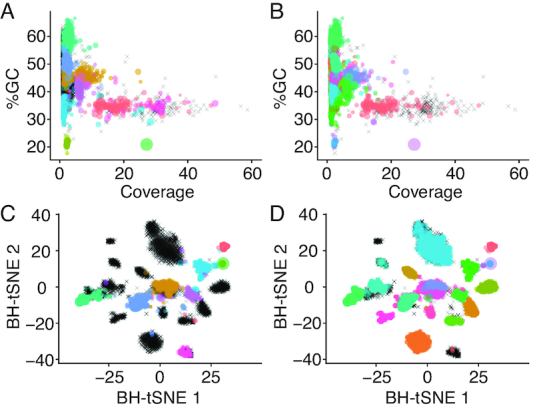
Figure 2.

Visualization of genome bins from a host-associated metagenome derived from semi-manual binning (left column, (A) and (C)) versus automated binning (right column, (B) and (D)). Points represent contigs and are colored based on their assigned bin with size scaled by length; unclustered contigs are represented by black crosses. In the top row ((A) and (B)), contigs are plotted on axes of GC% and coverage, while in the bottom row ((C) and (D)), contigs are plotted on the two dimensions derived from dimension-reduction of 5-mer frequencies by Barnes-Hut Stochastic Neighbor Embedding.
