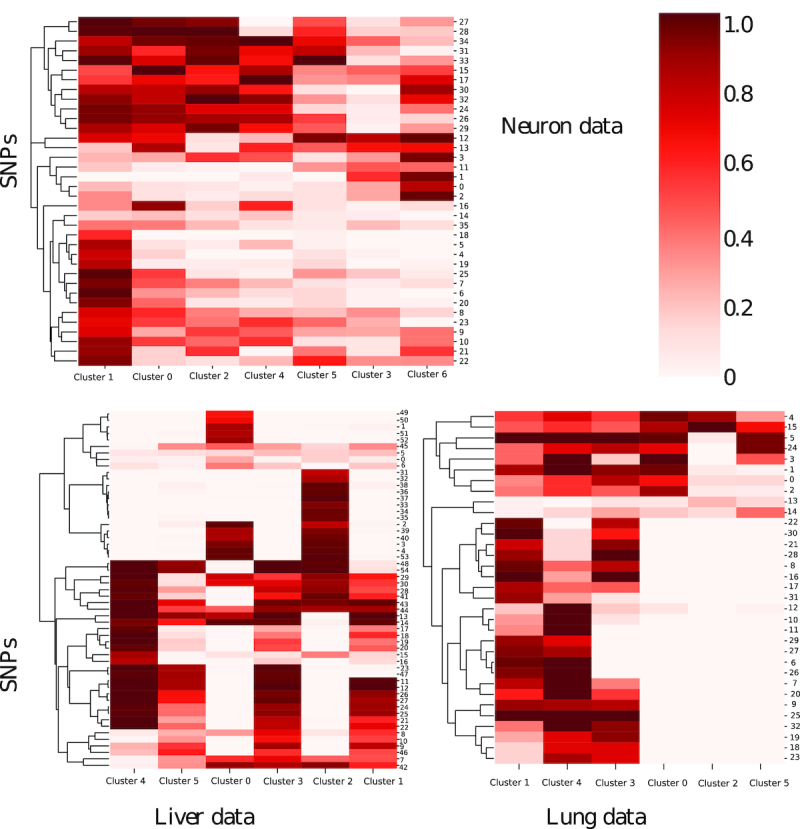
Figure 3.

Distribution of predicted SNPs in clusters. All the clusters are ordered based on the trajectory inference. In many cases, we see SNPs at contiguous clusters which can explain their usefulness for reconstructing the trajectories of the different studies. Still, some SNPs (e.g. cluster 2 in the liver data) are very specific and only detected for one cell type.
