Figure 3.

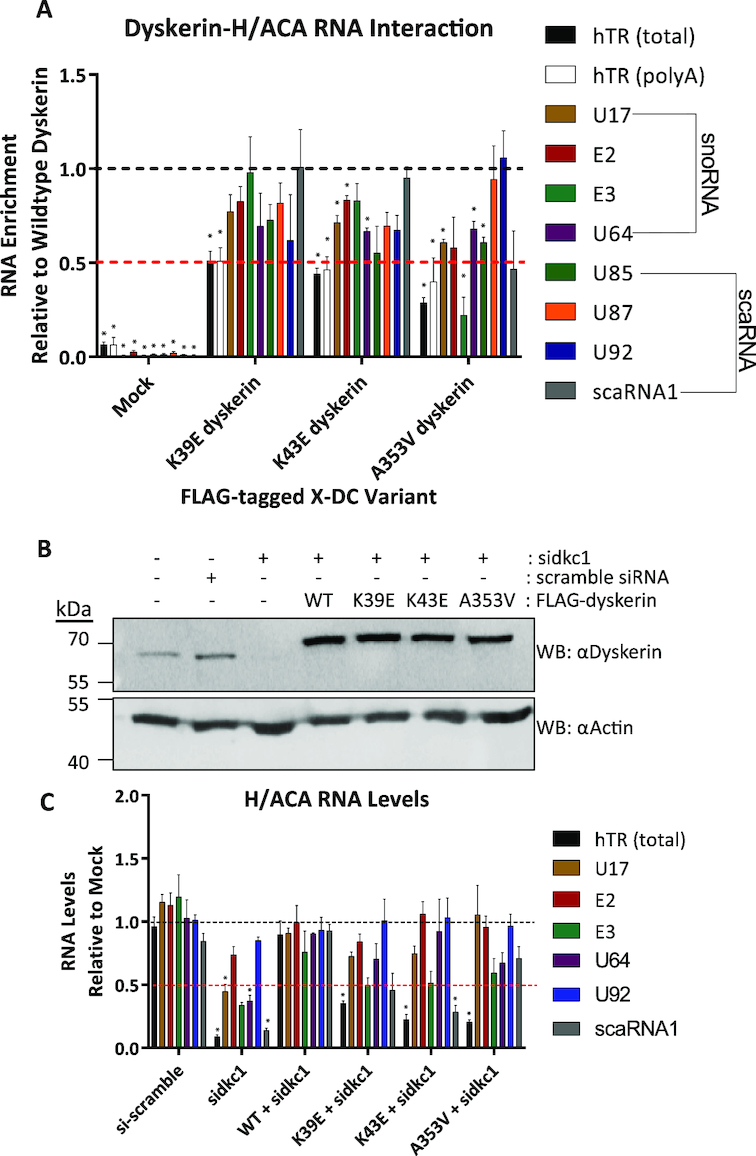
N-terminal dyskerin variants disrupt the dyskerin–RNA interaction and lead to reduced hTR accumulation in cells depleted for endogenous dyskerin. Dyskerin-RNA interactions were assessed by IP of FLAG-tagged dyskerin followed by RNA extraction and qPCR. Relative to wildtype IP fractions (indicated by black dashed line), dyskerin variants K39E, K43E, and A353V display (A) reduced enrichment of hTR following IP (approximately at or below 50% of wildtype, indicated by the red dashed line). Black bars indicate total hTR (cDNA primed with random hexamer) and white bars outlined in black indicate precursor hTR with poly(A) tails (cDNA primed with oligo dTs). Other H/ACA RNAs examined are indicated by coloured bars, and listed in the figure legend to the right of the graph. HEK293 cells lacking FLAG-tagged dyskerin (indicated as mock) were used as a negative control for RNA binding to the FLAG antibody and/or Protein G Sepharose. Mock cells were subject to the same IP protocol detailed for fractions containing FLAG-tagged dyskerin. These data represent experimental replicates of n = 3. Statistically significant reductions in enrichment relative to wildtype are indicated by * (P value < 0.01). Error bars represent SEM. (B) Depletion of endogenous dyskerin with siRNA (sidkc1.B), as well as expression of FLAG-tagged constructs (the higher molecular weight band detected by αDyskerin) was assessed by immunoblotting. (C) RNA levels were assessed from HEK293 cells with stable expression of FLAG-tagged wildtype or variants of dyskerin following 72h of siRNA targeting endogenous dyskerin (sidkc1.B), relative to empty vector HEK293 cells (mock) lacking FLAG-tagged dyskerin and untreated with siRNA. Mock cell RNA levels are indicated by the black dashed line, while the red dashed line indicates 50% of mock cell RNA levels. Empty vector HEK293 cells treated with scramble siRNA were used to control for possible effects of siRNA transfection. These data represent experimental replicates of n = 3. Statistically significant reductions in RNA enrichment compared to WT + sidkc1 treated cells are indicated by * (P value < 0.01). Error bars represent SEM.
