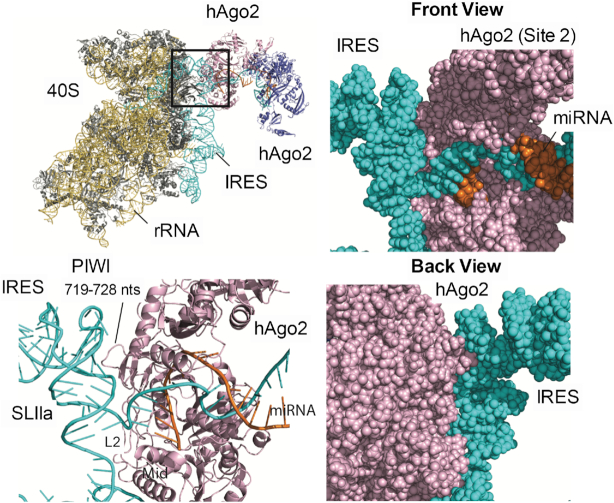
Figure 7.
Model of RISC-HCV IRES–40S interactions. A modeled RISC–IRES–40S complex (top left panel) and detailed views of hAgo2:IRES interactions (other panels). Front and back views of the space-filling representation show a tight fit with shape complementarity between hAgo2 and IRES SLIIa (right panels). hAgo2 Mid, L2 and PIWI domains interact with single- and double-stranded regions of the HCV IRES SLIIa (bottom left). The IRES (cyan), ribosomal RNA (yellow), ribosomal proteins (gray), hAgo2s (pink and blue), and miR-122s (orange) are indicated.

