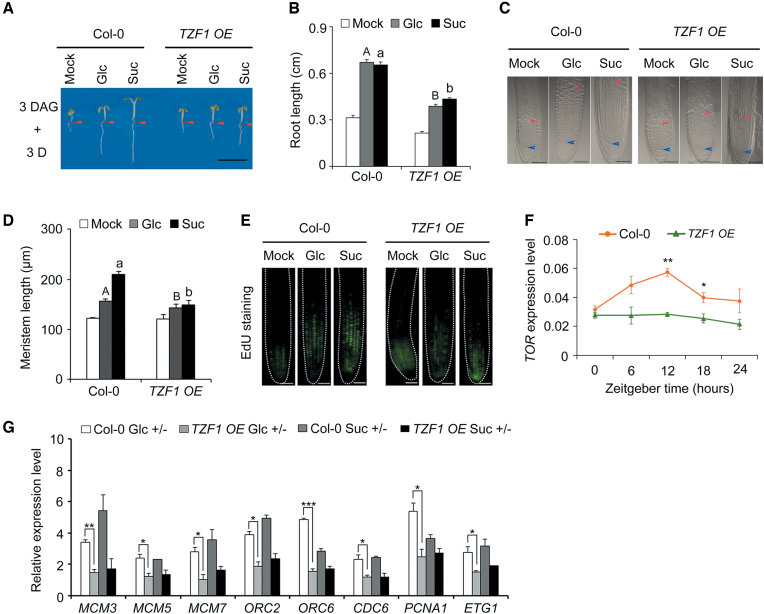
Figure 3.
Glc-TOR signaling is compromised in TZF1 OE line. (A) The diminished activation of Glc-TOR signaling in TZF1 OE line was evidenced by reduced primary root elongation. Three-day-old seedlings grown in liquid sugar-free 1/2 MS were treated with 15 mM Glc or Suc for 3 days in weak light (22°C, LD). Red arrows indicate the hypocotyl and root junctions. DAG, days after germination; D, day; Mock, sugar-free; Glc, glucose; Suc, sucrose; (scale bar: 0.5 cm). (B) Quantitative analysis of primary root length in (A). Data represent mean ± s.e.m. of 18 plants. The result was shown from one of three independent experiments with similar results. Root lengths were measured by using ImageJ. (C) DIC imaging of the root meristem zones of Col-0 and TZF1 OE line (scale bars: 50 μm). The blue arrow indicates the root quiescent cells, and the red arrow indicates the transition between meristem zone and elongation zone. (D) Quantitative analysis of the root meristem size with or without sugar treatment. Data represent mean ± s.e.m. of 13 plants. The result was shown from one of three independent experiments with similar results. The root meristem size was measured by using ImageJ. (E) S-phase entry of cell cycle in primary roots is reduced in TZF1 OE as evidenced by reduced EdU staining signals in situ (scale bar: 50 μm). (F) Time-course expression of TOR in Col-0 and TZF1 OE. The gene expression level was normalized by the geometric mean of ACT2 and TUB4 expression. The total RNA was isolated from the roots of 6-day-old seedlings grown in half-strength liquid MS medium without sugar in 12-h weak light (13 μmol m−1 s−1)/12-h dark cycles at 22°C. Data represent mean ± s.e.m. of three biological replicates. (G) Expression of S-phase marker genes was reduced in TZF1 OE with sugar treatments. For RNA extraction, the roots were harvested from the seedlings treated with 15 mM Glc or Suc for 3 days after growing in liquid sugar-free 1/2 MS for 3 days in weak light (22°C, LD) at ZT8. The gene expression level was normalized by ACT2 expression. The bar value represented the gene expression levels in sugars treatment relative to the corresponding expression levels in sugar-free condition. Data represent mean ± s.e.m. of three biological repeats. Different letters in (B) and (D) represent significant difference at P < 0.01 by one-way ANOVA using SPSS software. Uppercase letters compare with each other in 15 mM Glc treatment condition, and lowercase letters compare with each other in 15 mM Suc treatment condition. The asterisk in (F) and (G) indicates significant difference as * P < 0.05, ** P < 0.01, and *** P < 0.001 by t-test.

