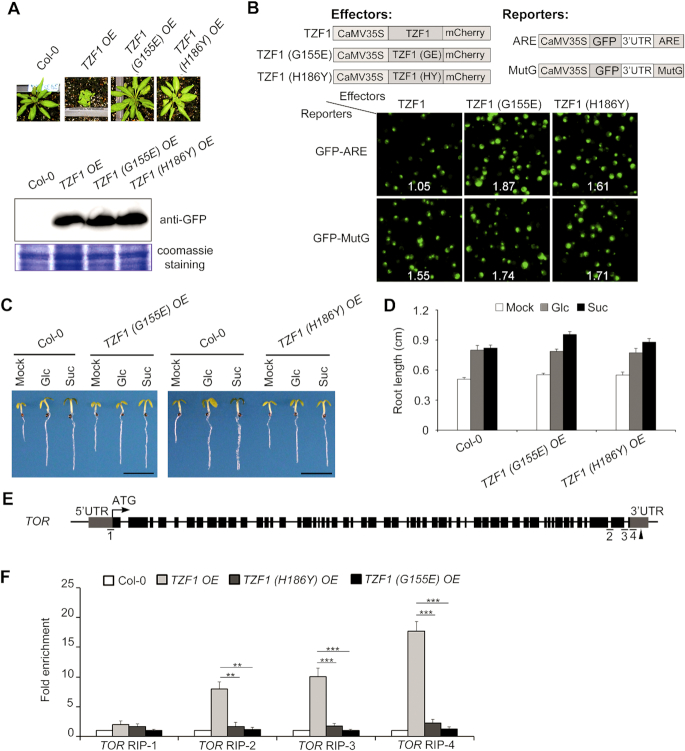
Figure 6.
TZF motif is critical for TZF1 to bind TOR mRNA and mediate TOR signaling. (A) The two intragenic mutations, G155E and H186Y in the transgene CaMV35S:TZF1-GFP abolished the TZF1 OE phenotypes. Compared to TZF1 OE plants, the two EMS point mutants (G155E in inter-ZF region and H186Y in 2nd zinc finger) displayed non-compact WT phenotypes. The expression levels of the two mutant GFP fusion proteins were comparable to that of the WT TZF1-GFP in a Western blot analysis detected by the GFP antibody. (B) TZF1 OE mutants (G155E and H186Y) were ineffective in triggering mRNA decay. Arabidopsis protoplasts were transiently co-expressed with a pair of effector (TZF1 WT or mutant protein) and reporter (GFP fused with ARE or mutated ARE (MutG) at 3′UTR) (see Lin et al., 2011 for detailed methods). WT TZF1 protein triggered GFP-ARE (but not GFP-MutG) reporter gene decay specifically, as indicated by reduced green fluorescence signals (upper left). No differences were observed in any effector-reporter pairs using G155E or H186Y mutant protein. Number in each image indicates the signal ratio of GFP/mCherry derived from the expression of reporter and effector, respectively. (C, D) The TZF1 (H186Y) OE and TZF1 (G155E) OE lines responded to Glc-TOR signaling normally. Three-day-old seedlings grown in liquid sugar-free 1/2 MS were treated with 15 mM Glc or Suc for 3 days in weak light (22°C, LD). Mock, sugar-free, Glc, glucose; Suc, sucrose. Data represent mean ± s.e.m. of 19 plants. The result was shown from one of three independent experiments with similar results. Root lengths were measured by using ImageJ. Scale bar in (C) is 0.5 cm. (E) Diagram depicting the putative TZF1-binding sites in the TOR. Black arrowheads indicate the positions of ARE elements, the putative TZF1-binding sites. Fragments underlined with numbers indicate the RIP-qPCR targets. (F) RIP–qPCR results indicated a direct binding of TZF1 to TOR mRNA. Ten-day-old seedlings grown at 22°C under LD condition was collected at ZT8 for this analysis. Data represent mean ± s.e.m. of three biological replicates. The asterisk indicates significant difference as ** P < 0.01 and *** P < 0.001 by t-test.

