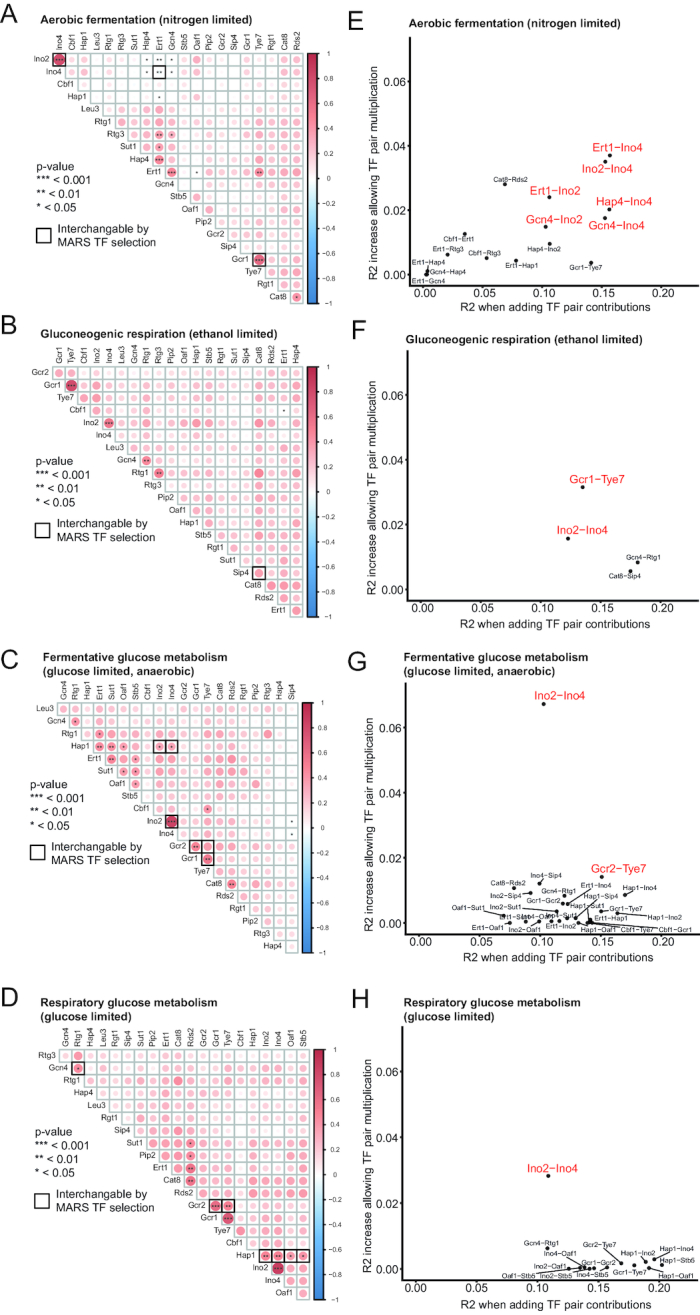
Figure 3.

Exploring contributions of collinear TF pairs to transcriptional regulation. (A–D) Correlation plots illustrating Pearsons correlations (in color) between TF binding in promoters of metabolic genes. Significance (Pearson's product moment correlation coefficient) is illustrated for TF pairs with P < 0.05, by one or several asterisks, as indicated. Pairs of significantly collinear TFs that are interchangeable in the MARS TF selection in Figure 2B–E are indicated by a stronger border in (A–D). (E–H) Linear regressions of collinear TF pairs were tested with and without allowing a multiplication of TF signals of the two TFs. TF pairs indicated in red and with larger fonts have an R2 of the additive regression >0.1 and increased performance with including a multiplication of the TF pairs of at least 10%.
