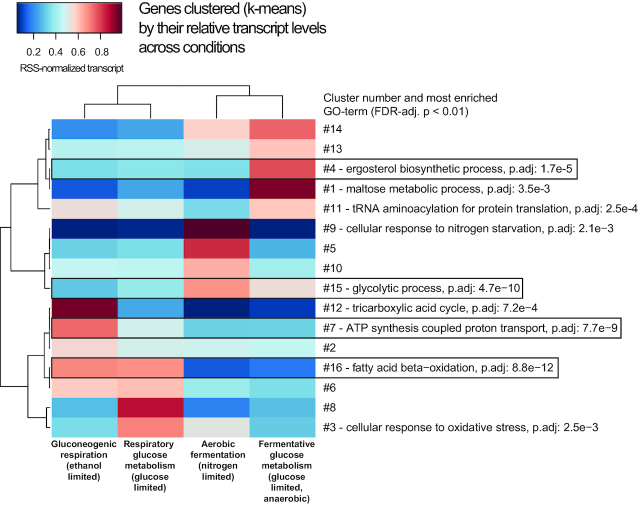
Figure 4.
Clustering genes by their relative change in expression (sum of squares normalization) over the four experimental conditions gives enrichment of functional groups of genes. For clusters which have one or several significantly (FDR-adj P < 0.01) enriched GO terms, the top GO term is indicated with p.adj-value. Clusters containing central metabolic processes selected for further analysis with linear regressions in Figure 5 are indicated by a black frame.

