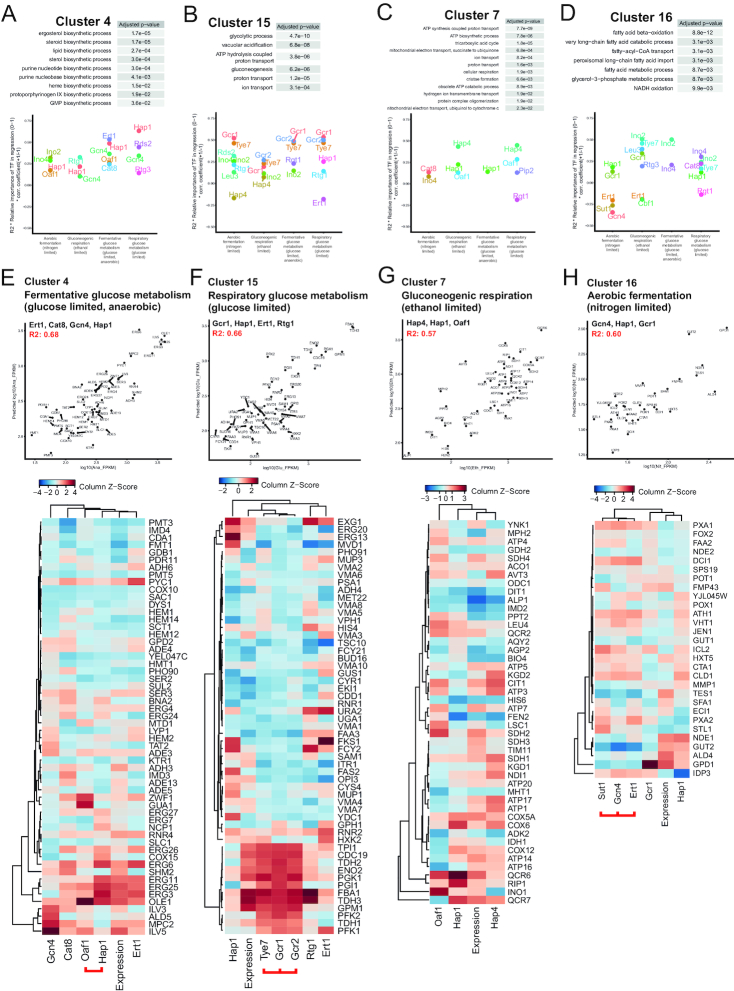
Figure 5.
Clustering genes by relative expression gives strong predictive models of the clustered genes. (A–D) All significant (P.adj < 0.05) GO terms for the clustered genes and the relative importance of the TFs selected to give the strongest predictions of transcript levels for the genes in the clusters in different conditions. Linear regressions (without splines) are used and importance is calculated by R2 (of regression with selected TFs) *relative importance of each TF (0 to 1) *sign of coefficient (+1 is activation, –1 is repression). (E–H) Prediction plots showing the predicted transcript levels compared to the real transcript levels from using the selected TFs (written in subtitle of plots). R2 of predicted transcript levels compared to real transcript level is shown in red text. Heatmaps demonstrate the real transcript levels as well as binding signal of each TF normalized column-wise (Z-score). TFs linked by a red line under the heatmap have significant collinearity over the cluster genes and were demonstrated to be able replace the other(s) in the variable selection, thus having overlapping functions in regulation of genes in a given cluster.

