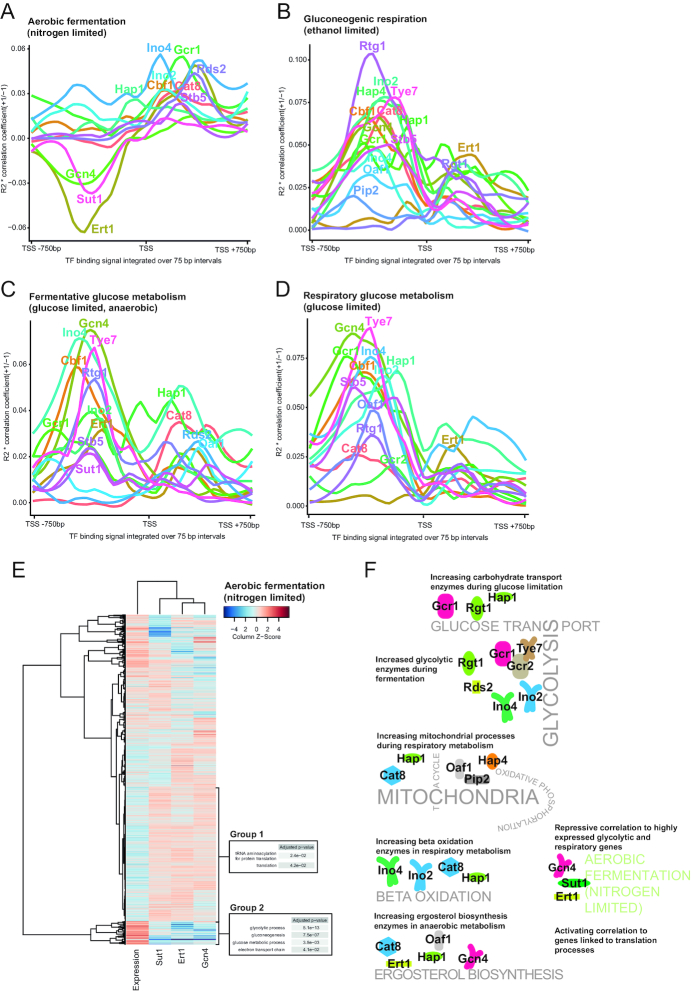
Figure 6.
Comparing TF importance in different segments of the promoter shows a distinct pattern of TF importance during aerobic fermentation as compared to the other conditions. (A–D) Linear regressions, regressing the TF binding signal of each TF individually, in the indicated segments of the promoters, against the expression levels. Lines are labeled by the TF name near the highest absolute y-axis value. (E) Two groups of genes where binding of Sut1, Ert1 and Gcn4 in −450 to −250 relative to the TSS is correlated to each other and oppositely correlated to transcript levels. (F) Summary of the strongest predicted links between TF function and selected metabolic processes. Based on data presented in Figures 4 and 5, Supplementary Figure S4E–F and Figure 6A–E.

