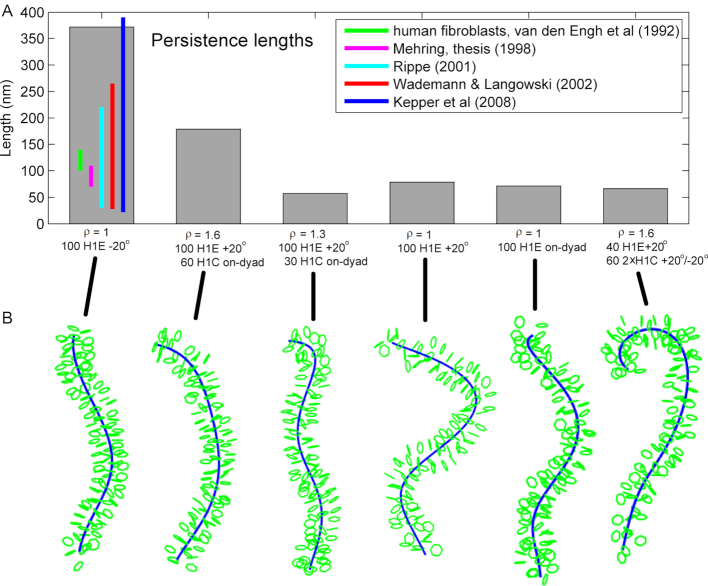
Figure 4.
Persistence lengths and fiber images for various array setups for NRL = 200 bp. Six setups are depicted, as shown below vertical bars. The fibers are schematic representations with only nucleosomes (green), with superhelix axis (blue), as calculated by the analysis routine (see the Persistence length calculation routine in the Supplementary material).

