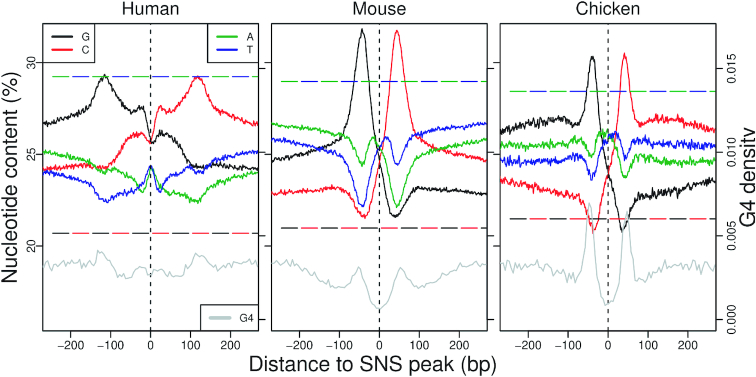
Figure 3.
Replication origin sequence signature: Average nucleotide content in the 500 bp region centred on the SNS peak (plain line). Genome-wide average nucleotide contents are indicated by broken lines. Note that the 95% confidence interval were so small that they were not distinguishable when plotted on the same figure. Gray lines present the total number of G4 motifs found in all origins for 5 bp windows. To achieve a bp resolution for G4 motifs, we summarize each G4 motif by the position of its middle nucleotide.

