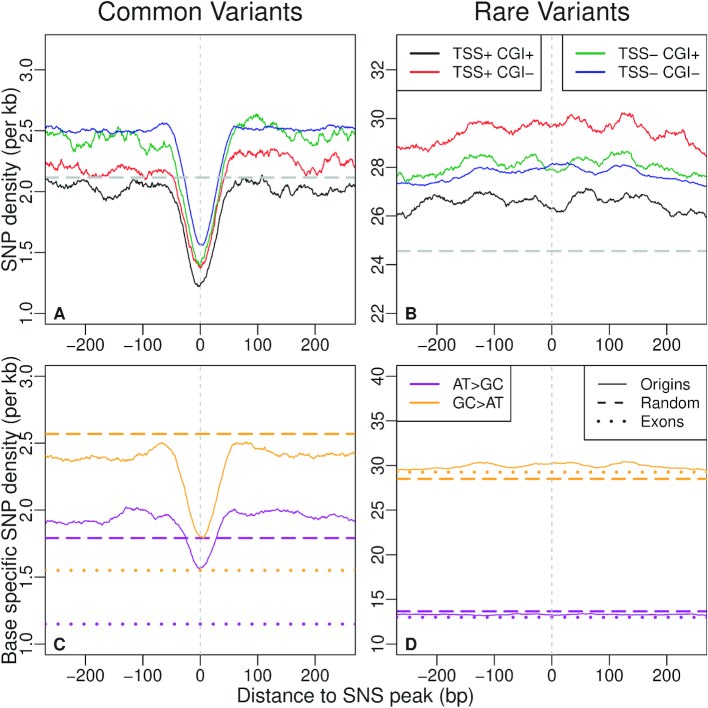
Figure 4.
Density of genetic polymorphism around origins: average SNP density in the vicinity of all human SNS peaks (plain lines) for different classes of origins, depending on their association with CGI and/or TSSs. Genome-wide averages are indicated by broken lines. (A) Common variants (DAF > 10%). (B) Rare variants (DAF < 1%). (C, D) Base-specific SNP density (see Materials and Methods section) in the vicinity of all human SNS peaks (plain line). Broken lines: genome-wide average. Dotted line: average base-specific SNP density in all human coding exons. (C) Common A or T to C or G ( ) and C or G to A or T (
 ) variants (DAF > 10%). (D) Rare variants (DAF < 1%).

