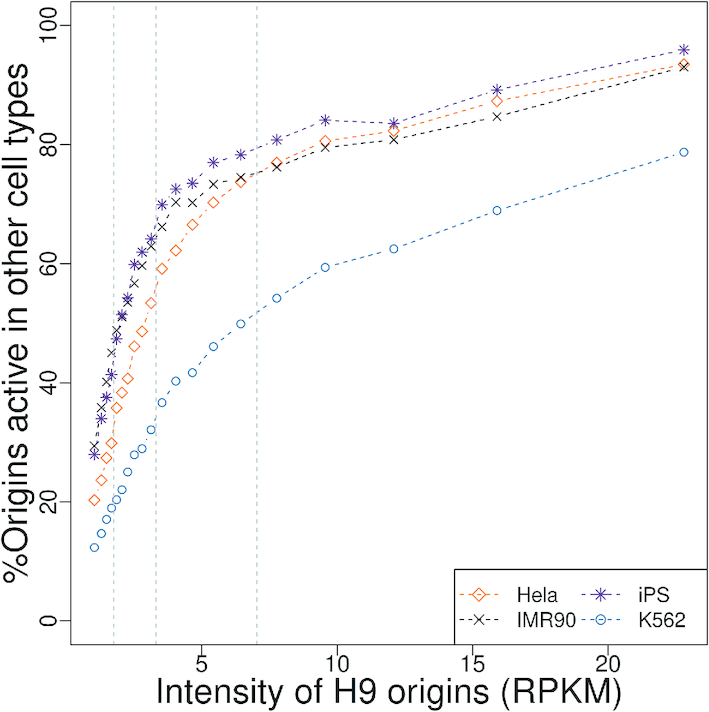
Figure 6.

Fraction of human H9 origins that are active in four other human cell lines. Human H9 origins were categorized by increasing intensity (RPKM: number of SNS reads per kb, per million mapped reads). We grouped origins into 20 classes. For origins of a given class of intensity, we computed the percentage of origins of this category, that were also active in the other four cell lines. Grey dashed lines represent the 25, 50 and 75% origin activity quantiles.
