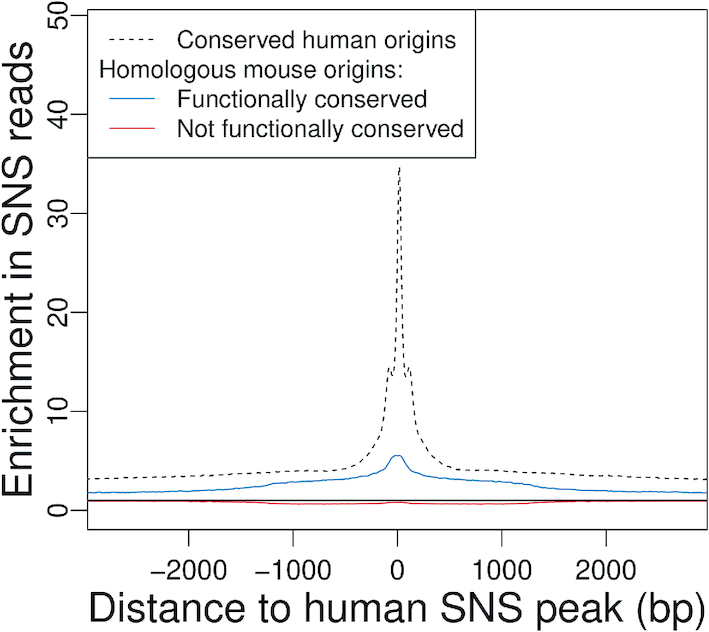
Figure 7.

Conservation of replication origin activity at homologous loci. Average SNS read enrichment profile regions centered on the homolog of human SNS peaks in the mouse genome (plain line) compared to the genome-wide average, for conserved origins (N = 32 042) and non-conserved origins (N = 56 078). Dotted line: Average enrichment profile for all human origins overlapping a CGS, centered on the SNS peaks. Only origins with conserved SNS peaks are presented. Black plain line: Expected value without enrichment.
