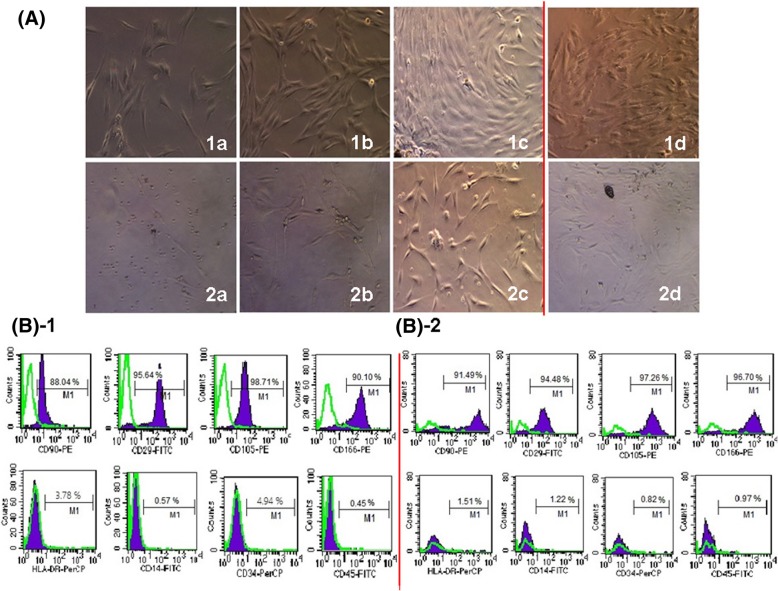
Fig. 1.
Characterization of cell surface markers and morphology of BM-MSCs. A The morphology of ALL MSCs (1a–1d) and AA MSCs (2a–2d). The morphology of the primary passage (P0) and the P4 passage MSCs of ALL (upper panel) and AA (lower panel) at different time points (primary culture—a: day 7, b: day 10, c: day 14; passage culture—d: day 7 P4 MSCs) (× 10). B-1, B-2 Cell surface markers of P4 MSCs were analyzed using FCM. Antibodies against CD90, CD29, CD105, and CD166 (upper panel), and CD34, CD45, CD19, and HLA-DR (lower panel) were used to characterize ALL MSCs (B-1) and AA MSCs (B-2). The green curves indicated the isotype controls. The purple curves indicated the expression levels of MSC surface markers

