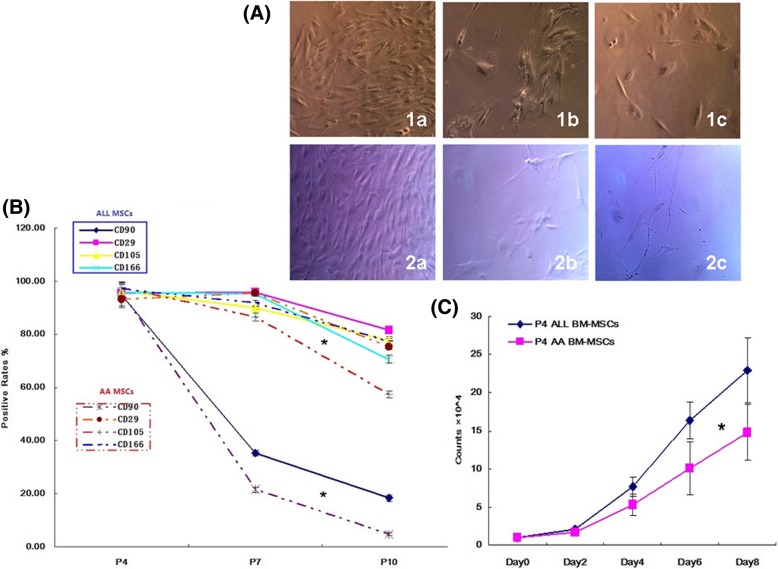
Fig. 2.
Morphology changes and growth evaluation of the two types of MSCs. A Morphology changes of ALL MSCs (1a–1c) and AA MSCs (2a–2c) at P4, P7, and P10 (a: P4, b: P7, c: P10) (× 10). B Cell surface markers of P4, P7, and P10 MSCs were analyzed using FCM. Antibodies against CD90, CD29, CD105, and CD166 were used to characterize BM-MSCs (solid dark line for ALL and dotted line for AA MSCs). The results represent mean ± SD (three ALL and three AA MSCs, *P < 0.05). C Growth evaluation of P4 MSCs at different time points. The results represented mean ± SD (*P < 0.05)

