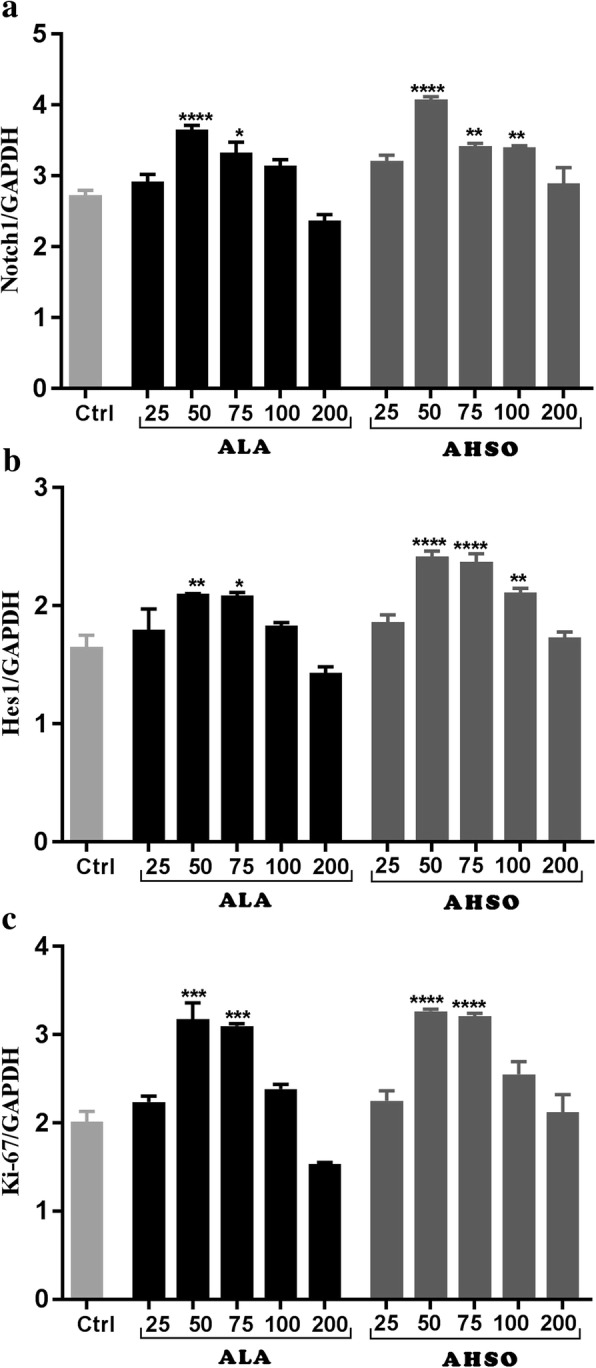
Fig. 2.

Effects of ALA and AHSO on Notch1, Hes1 and Ki-67. Cells were exposed to different concentrations of ALA or AHSO (25, 50, 75, 100, and 200 μM) for 5 days. Total RNA was prepared from each culture, cDNA synthesized and subjected to real-time PCR, using specific primers for Notch1 (a), Hes1 (b), or Ki-67 (c). GAPDH was used as an internal control. The values are expressed as the mean ± SEM. A one-way analysis of variance (ANOVA) following Tukey post-hoc test was performed to compare the mean values. *, p < 0.05; **, p < 0.01; and ****, p < 0.0001 were considered significant
