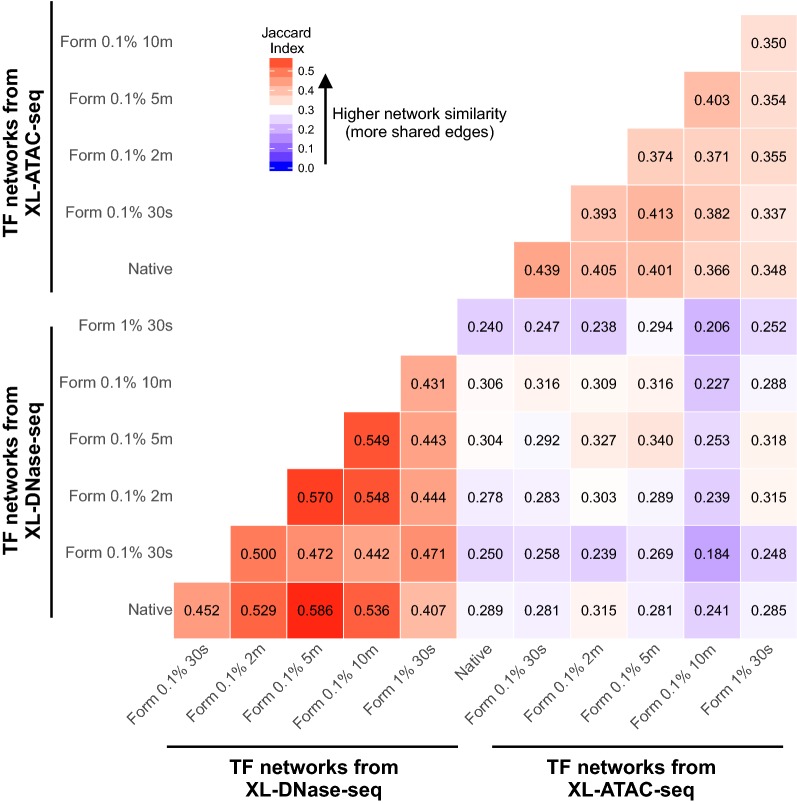
Fig. 6.
Comparison of TF regulatory networks derived from TF footprints in XL-DNase-seq and XL-ATAC-seq data. The similarity between all the pairs of TF regulatory networks was quantified using Jaccard Index (ranging from 0 to 1), and the results are represented in a heatmap. The number in each component indicates the Jaccard Index of the given pair

