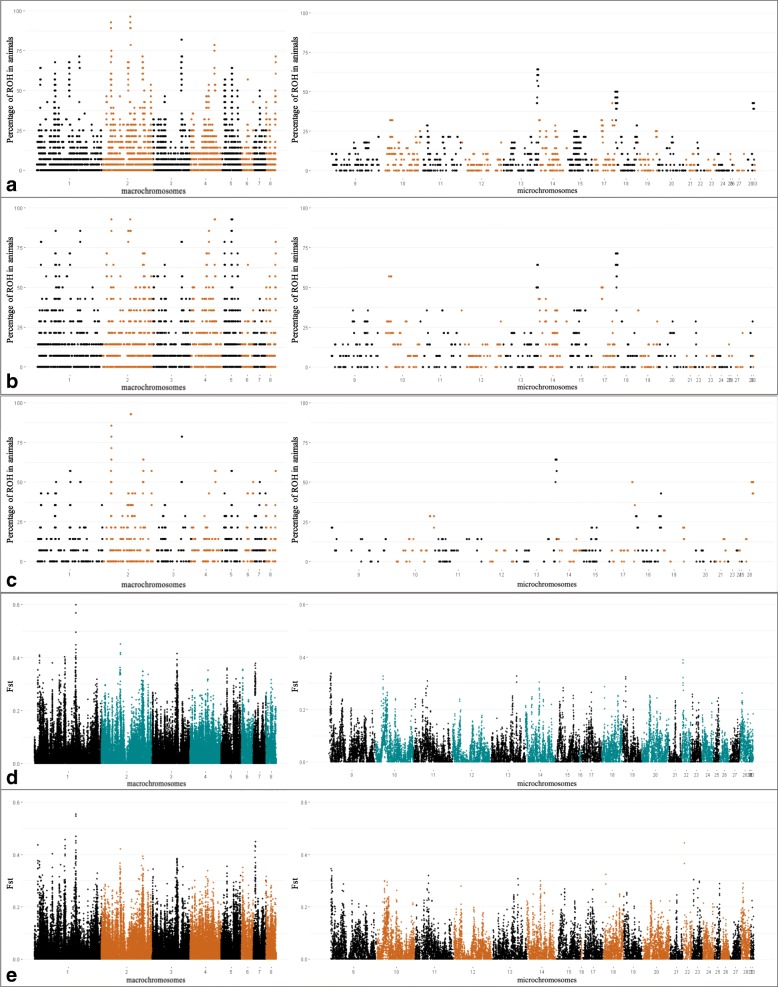
Fig. 4.
Manhattan plot of genomic regions and percentage of animals that shares the candidate selection signatures as well, SNPs and INDELs Fst windows. a: ROH pools detected in all the 28 animals; b: ROH pools detected in the 14 birds from 16th generation; c: ROH pools detected in the 14 birds from 7th generation; d: SNPs Fst windows; e: INDELS Fst windows. For a, b and c, the X-axis represents the chromosomes, and Y-axis shows the proportion of animals that shares the ROH pools. For d and e, the X-axis represents the chromosomes, and Y-axis shows the Fst values

