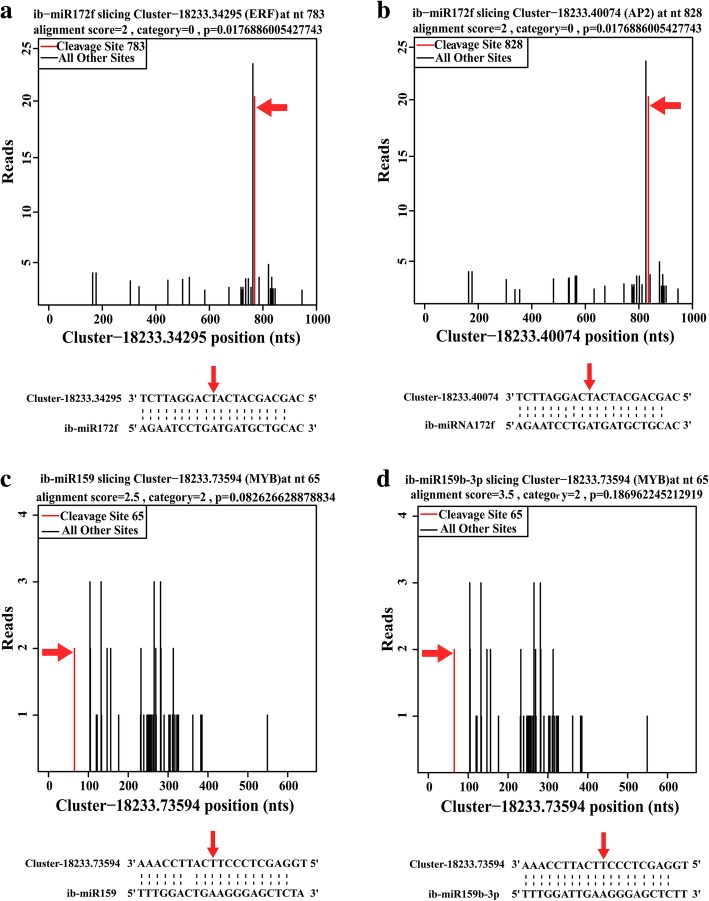
Fig. 4.
Target plot (t-plots) of representative ib-miRNA targets confirmed by degradome sequencing. The red lines showed the distribution of the degradome tags along the target mRNA sequences. The red arrows represented the cleavage nucleotide positions on the target genes. a, b Cleavage features in ibERF and ibAPETALA2 mRNA by ib-miR172f. c, d Cleavage features in ibMYB mRNA by ib-miR159 and ib-miR159b-3p

