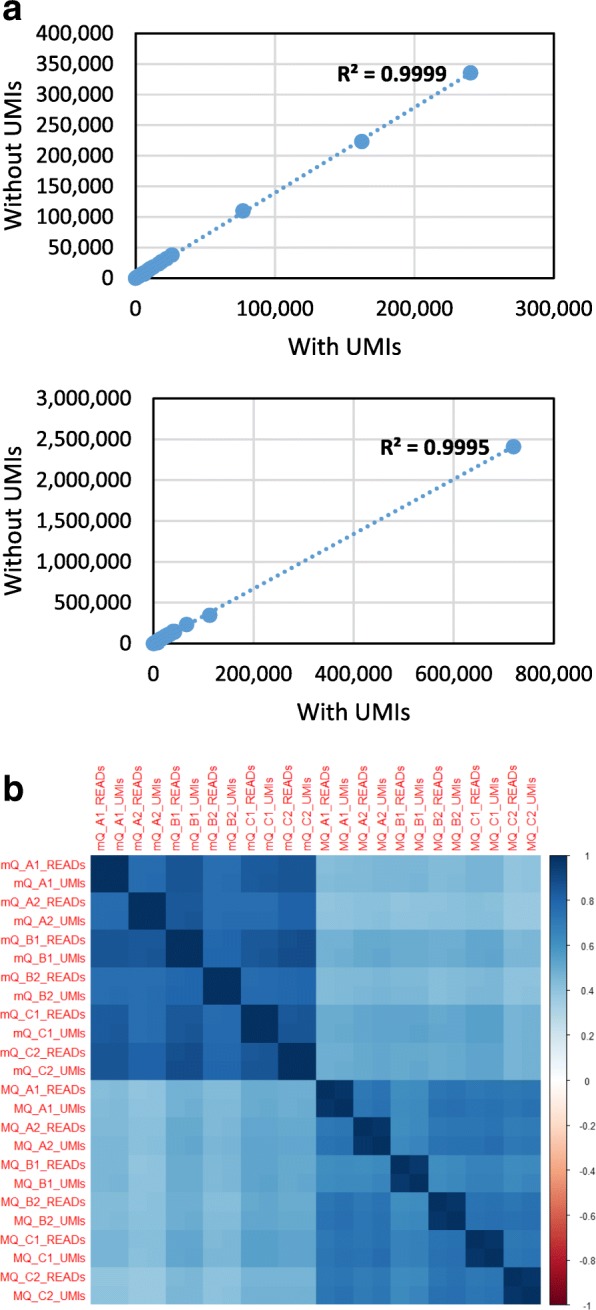
Fig. 1.

Effect of correction for PCR duplication using UMIs. a Scatter plot of the number of reads versus the number of unique UMIs mapping to each miRNA (values are the mean of 6 samples). b Correlation between all QIAseq miRNA profiles when analysed with (*_UMIs) or without (*_READS) UMI correction. The correlation between individual samples with and without UMI correction is extremely high (≥0.97).The correlations are higher between replicate samples prepared with the same RNA extractions
