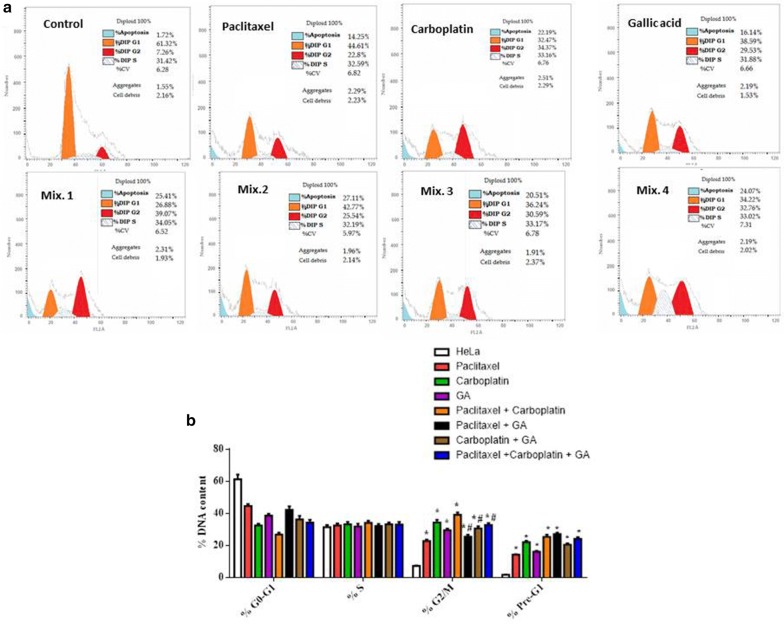
Fig. 2.
Cell cycle analysis of HeLa cells following treatment with different drugs. a Histogram showing the percentages of cells in different cell cycle phases. b Bar chart showing the percentages of cells in different cell cycle phases. *Significant from control group at P < 0.0001, #significant from Paclitaxel + Carboplatin group at P < 0.0001; GA Gallic acid

