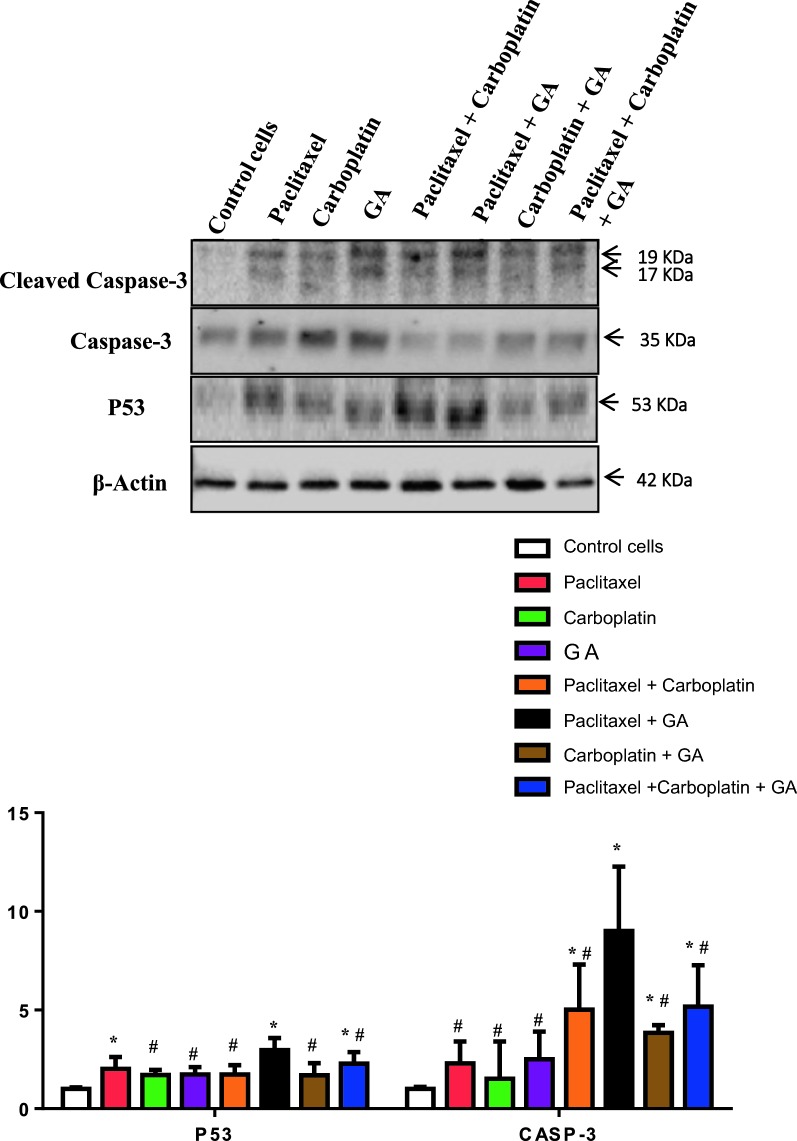
Fig. 5.
The immunoblotting of P53 and cleaved Caspase 3. Control group for both P53 and cleaved caspase-3/Caspase ratio and values were represented as mean ± SD of treated cells compared with Control cells (untreated cells) (P < 0.0001). The detected proteins were quantified and normalized to β-actin. *Significant from HeLa group at P < 0.01, #significant from Paclitaxel + GA group at P < 0.05. The upper part of the figure illustrates immunoblot of P53, Cleaved Caspase-3/Caspase and β-actin from three separate experiments

