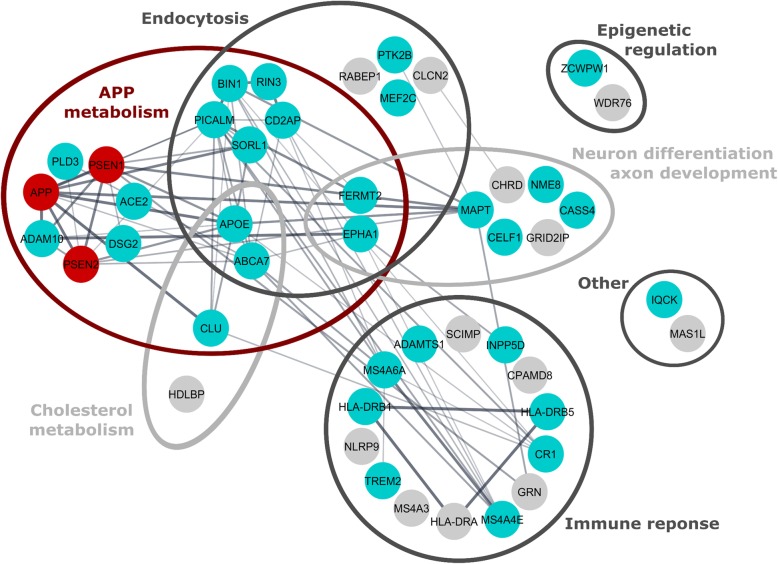
Fig. 2.
Alzheimer disease risk factors and associated cellular mechanisms. Schematic representation of the biological processes linked to the different proteins being linked to familial AD (red dots) and to an increased risk to develop LOAD (cyan dots). Still to be validated LOAD risk factors are indicated as grey dots. Edges denote protein-protein associations. The figure was generated in Cytoscape with the “String enrichment” plugin and completed with recent interactions from Pubmed articles

