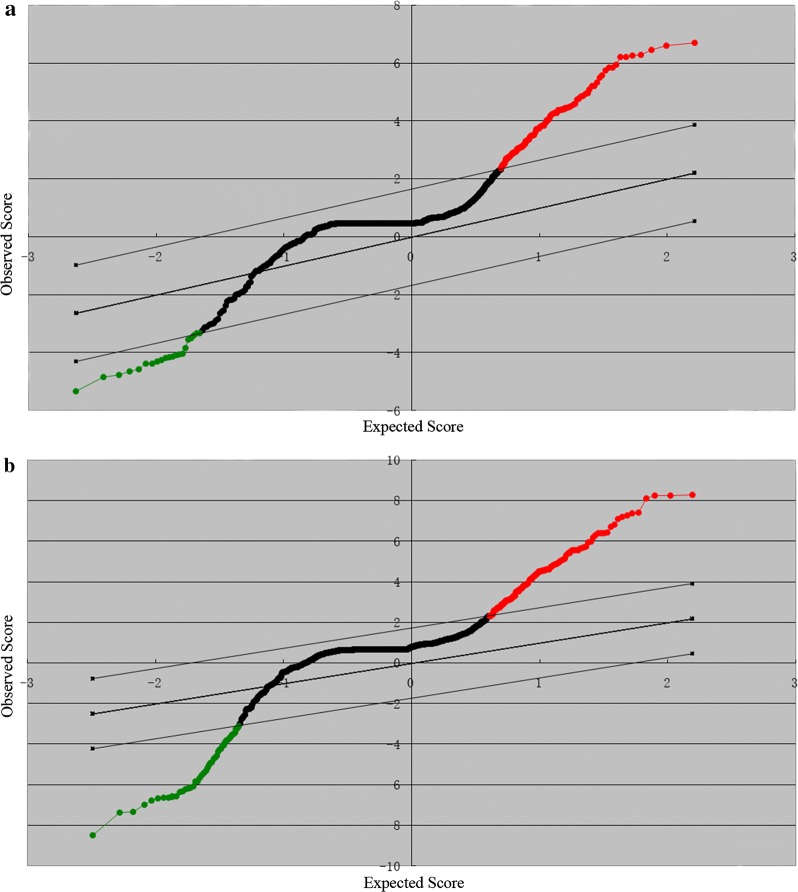
Fig. 1.
Scatter plot analysis for the microarray expression data of 1849 miRNAs in SAM. Red and green dots represented upregulated miRNA and downregulated miRNA respectively. a Scatter plot analysis of miRNA expression between patients with NPC and healthy subjects. b Scatter plot analysis of miRNA expression between patients with NPC and the combination of HNTs and HSs

