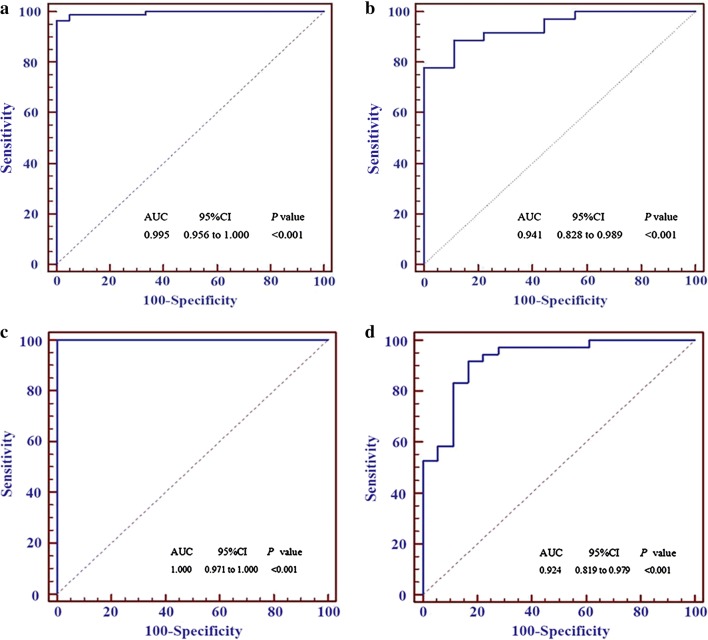
Fig. 5.
The ROC curves of the 8-miRNA and 16-miRNA signatures. a The ROC curve (blue) of the 8-miRNA signature in the training group-1. b The ROC curve (blue) of the 8-miRNA signature in the validation group-1. c The ROC curve (blue) of the 16-miRNA signature in the training group-2. d The ROC curve (blue) of theb16-miRNA signature in the validation group-2

