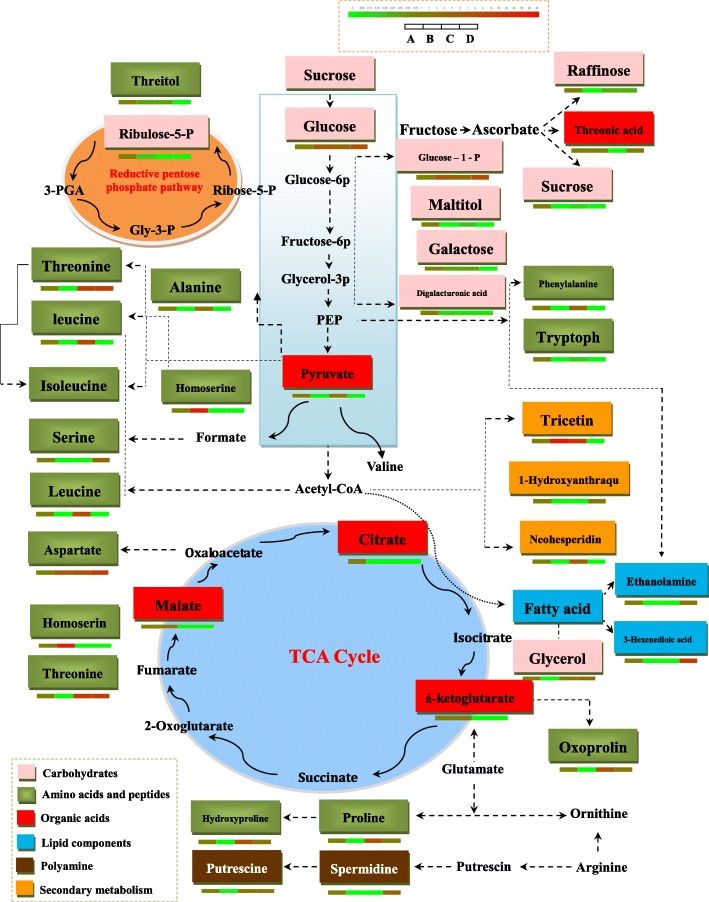
Fig. 8.
Primary metabolism pathways of measured metabolites in leaves of Herpetospermum pedunculosum (Ser.) Baill.Represented pathways are simplified versions of the tricarboxylic acid (TCA) cycle, carbohydrates, amino acid and organic acids. Each box represents one metabolite. Carbohydrates, amino acid, organic acids, lipid components, polyamine and secondary metabolism are displayed in pink, green, red, blue, brown and orange. Each column represent different altitudes (from left to right: a, 2800 m, b, 3000 m, c, 3100 m, d, 3300 m) which is shown in the upper left corner. Average metabolite intensity is color coded according the scale in the upper right corner

